3910 Renaissance Ct Antioch, CA 94509
Deer Valley NeighborhoodEstimated Value: $628,831 - $733,000
3
Beds
3
Baths
2,193
Sq Ft
$305/Sq Ft
Est. Value
About This Home
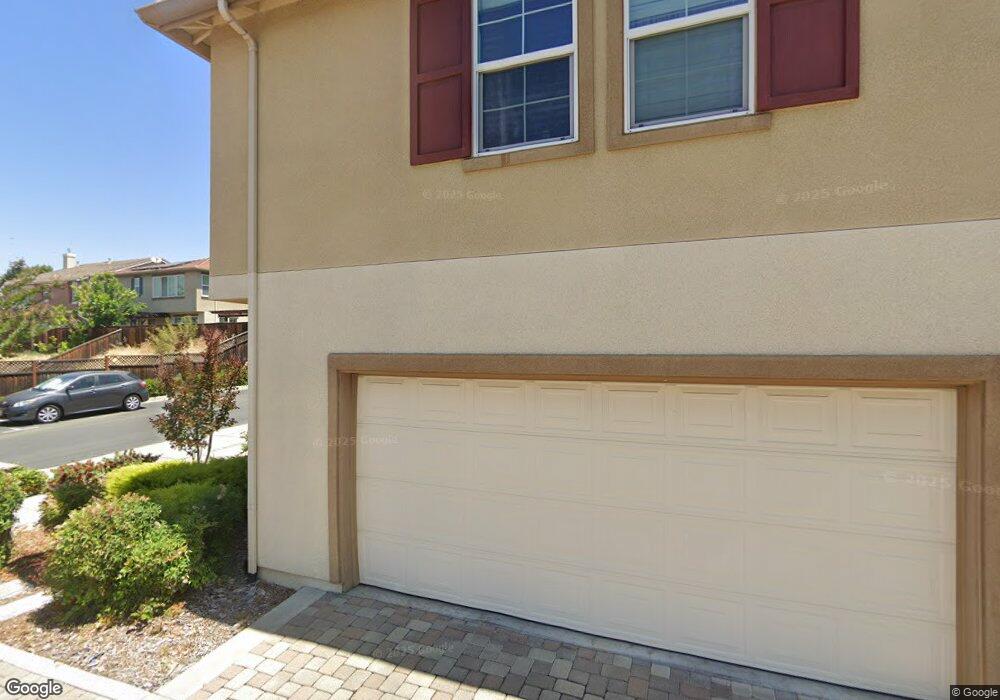
This home is located at 3910 Renaissance Ct, Antioch, CA 94509 and is currently estimated at $669,458, approximately $305 per square foot. 3910 Renaissance Ct is a home located in Contra Costa County with nearby schools including John Muir Elementary School, Dallas Ranch Middle School, and Deer Valley High School.
Ownership History
Date
Name
Owned For
Owner Type
Purchase Details
Closed on
Oct 5, 2018
Sold by
Paramel Josephine and Ramos Armando
Bought by
Ocampo Jonathan A and Ocampo Khristine H
Current Estimated Value
Home Financials for this Owner
Home Financials are based on the most recent Mortgage that was taken out on this home.
Original Mortgage
$481,124
Outstanding Balance
$419,569
Interest Rate
4.5%
Mortgage Type
FHA
Estimated Equity
$249,889
Purchase Details
Closed on
Apr 2, 2008
Sold by
Kb Home South Bay Inc
Bought by
Paramel Josephine and Ramos Armando
Home Financials for this Owner
Home Financials are based on the most recent Mortgage that was taken out on this home.
Original Mortgage
$314,071
Interest Rate
6.31%
Mortgage Type
FHA
Purchase Details
Closed on
Mar 13, 2008
Sold by
Kaufman Capital Llc
Bought by
Kb Home South Bay Inc
Home Financials for this Owner
Home Financials are based on the most recent Mortgage that was taken out on this home.
Original Mortgage
$314,071
Interest Rate
6.31%
Mortgage Type
FHA
Create a Home Valuation Report for This Property
The Home Valuation Report is an in-depth analysis detailing your home's value as well as a comparison with similar homes in the area
Home Values in the Area
Average Home Value in this Area
Purchase History
| Date | Buyer | Sale Price | Title Company |
|---|---|---|---|
| Ocampo Jonathan A | $490,000 | Chicago Title Company | |
| Paramel Josephine | $319,000 | First American Title Company | |
| Kb Home South Bay Inc | -- | First American Title Company |
Source: Public Records
Mortgage History
| Date | Status | Borrower | Loan Amount |
|---|---|---|---|
| Open | Ocampo Jonathan A | $481,124 | |
| Previous Owner | Paramel Josephine | $314,071 |
Source: Public Records
Tax History Compared to Growth
Tax History
| Year | Tax Paid | Tax Assessment Tax Assessment Total Assessment is a certain percentage of the fair market value that is determined by local assessors to be the total taxable value of land and additions on the property. | Land | Improvement |
|---|---|---|---|---|
| 2025 | $6,162 | $546,600 | $156,171 | $390,429 |
| 2024 | $5,938 | $535,883 | $153,109 | $382,774 |
| 2023 | $5,938 | $525,376 | $150,107 | $375,269 |
| 2022 | $5,844 | $515,075 | $147,164 | $367,911 |
| 2021 | $5,668 | $504,977 | $144,279 | $360,698 |
| 2019 | $5,546 | $490,000 | $140,000 | $350,000 |
| 2018 | $4,041 | $361,027 | $22,631 | $338,396 |
| 2017 | $3,954 | $353,949 | $22,188 | $331,761 |
| 2016 | $3,854 | $347,009 | $21,753 | $325,256 |
| 2015 | $4,111 | $341,798 | $21,427 | $320,371 |
| 2014 | $4,759 | $328,000 | $20,563 | $307,437 |
Source: Public Records
Map
Nearby Homes
- 4010 Boulder Dr
- 4729 Matterhorn Ct
- 318 Redrock Dr
- 4002 Royal Links Ct
- 4041 Saint Andrews Way
- 4688 Matterhorn Way
- 4109 S Royal Links Cir
- 4737 Crestone Peak Ct
- 4836 Belford Peak Way
- 4925 Cache Peak Dr
- 4864 Belford Peak Way
- 137 Rainier Ln
- 4721 Torreys Peak Ct
- 720 Topaz Ct
- 4064 Montgomery Hill Dr
- 921 Clay Ct
- 924 Flintrock Dr
- 2101 Asilomar Dr
- 1525 Barkley Mountain Way
- 3401 Longview Rd
- 3908 Renaissance Ct
- 4002 Di Vinci Ct
- 4004 Di Vinci Ct
- 3900 Renaissance Ct
- 3906 Renaissance Ct
- 4808 Donatello Ct
- 3904 Renaissance Ct
- 4608 Botticelli Ct
- 4006 Di Vinci Ct
- 3902 Renaissance Ct
- 4806 Donatello Ct
- 4606 Botticelli Ct
- 4008 Di Vinci Ct
- 4000 Di Vinci Ct
- 4810 Donatello Ct
- 4804 Donatello Ct
- 3808 Amerigo Ct
- 4610 Botticelli Ct
- 4010 Di Vinci Ct