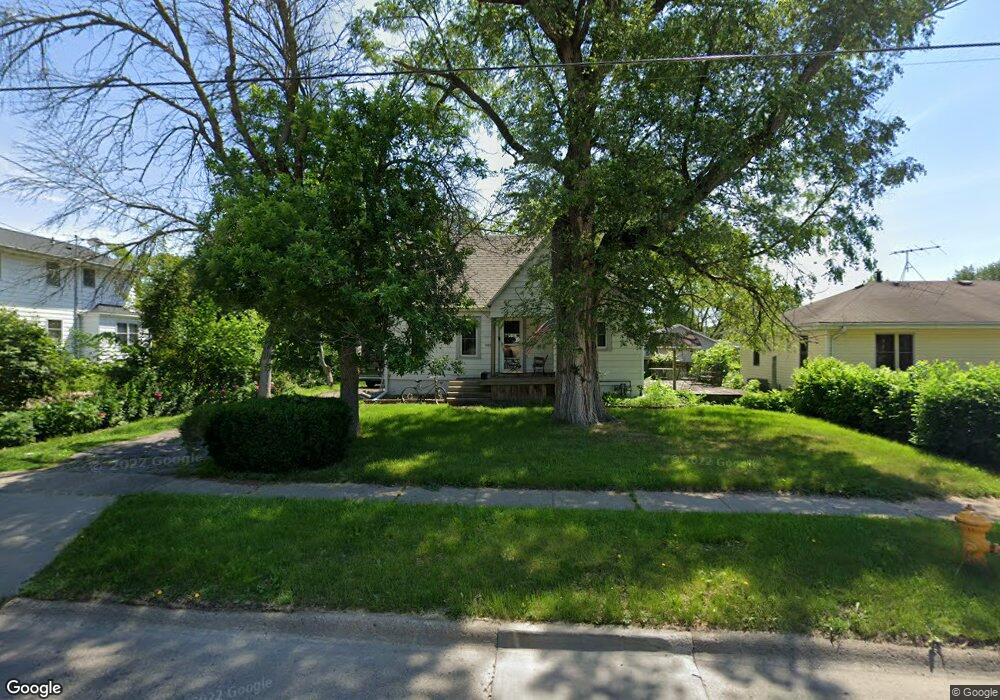
3911 70th St Urbandale, IA 50322
Estimated Value: $186,000 - $225,901
3
Beds
1
Bath
1,011
Sq Ft
$207/Sq Ft
Est. Value
About This Home
This home is located at 3911 70th St, Urbandale, IA 50322 and is currently estimated at $209,225, approximately $206 per square foot. 3911 70th St is a home located in Polk County with nearby schools including Urbandale Middle School, Urbandale High School, and St Pius X School.
Ownership History
Date
Name
Owned For
Owner Type
Purchase Details
Closed on
Jan 30, 2004
Sold by
Prather Teri L
Bought by
King Wendell C
Current Estimated Value
Home Financials for this Owner
Home Financials are based on the most recent Mortgage that was taken out on this home.
Original Mortgage
$90,000
Outstanding Balance
$39,446
Interest Rate
5%
Mortgage Type
Purchase Money Mortgage
Estimated Equity
$169,779
Create a Home Valuation Report for This Property
The Home Valuation Report is an in-depth analysis detailing your home's value as well as a comparison with similar homes in the area
Home Values in the Area
Average Home Value in this Area
Purchase History
| Date | Buyer | Sale Price | Title Company |
|---|---|---|---|
| King Wendell C | -- | A Title Escrow Co Inc |
Source: Public Records
Mortgage History
| Date | Status | Borrower | Loan Amount |
|---|---|---|---|
| Open | King Wendell C | $90,000 | |
| Closed | King Wendell C | $10,000 |
Source: Public Records
Tax History Compared to Growth
Tax History
| Year | Tax Paid | Tax Assessment Tax Assessment Total Assessment is a certain percentage of the fair market value that is determined by local assessors to be the total taxable value of land and additions on the property. | Land | Improvement |
|---|---|---|---|---|
| 2025 | $3,100 | $207,900 | $62,500 | $145,400 |
| 2024 | $3,100 | $187,800 | $55,800 | $132,000 |
| 2023 | $3,198 | $187,800 | $55,800 | $132,000 |
| 2022 | $3,160 | $157,300 | $48,700 | $108,600 |
| 2021 | $3,034 | $157,300 | $48,700 | $108,600 |
| 2020 | $2,982 | $143,800 | $44,300 | $99,500 |
| 2019 | $2,802 | $143,800 | $44,300 | $99,500 |
| 2018 | $2,702 | $129,600 | $39,200 | $90,400 |
| 2017 | $2,594 | $129,600 | $39,200 | $90,400 |
| 2016 | $2,522 | $122,700 | $36,500 | $86,200 |
| 2015 | $2,522 | $122,700 | $36,500 | $86,200 |
| 2014 | $2,334 | $117,300 | $34,200 | $83,100 |
Source: Public Records
Map
Nearby Homes