
Seller's Agent in 2018
Barbara Myers
Windermere Realty Trust
(541) 480-7183
62 Total Sales


Estimated Value: $603,352 - $644,000
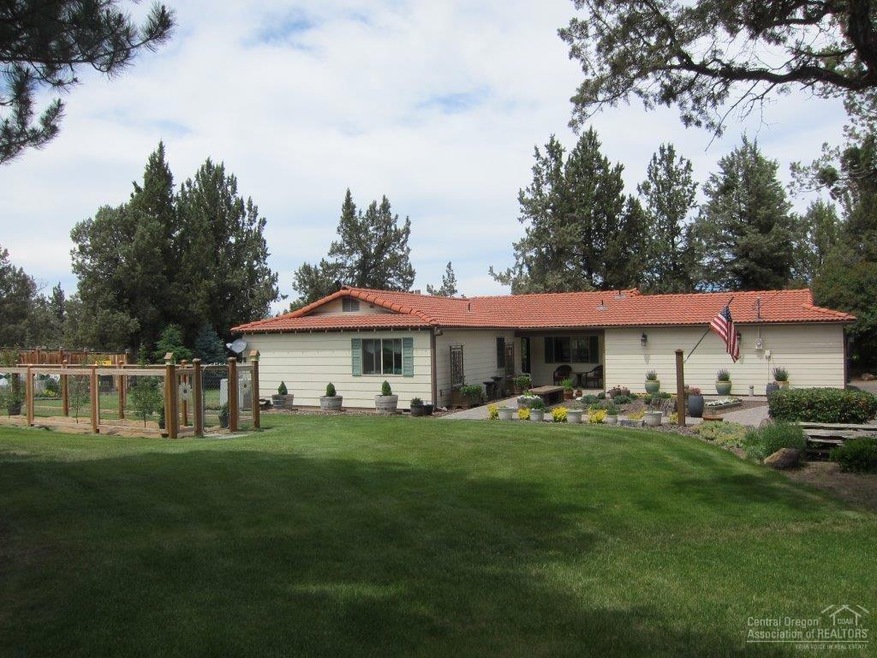
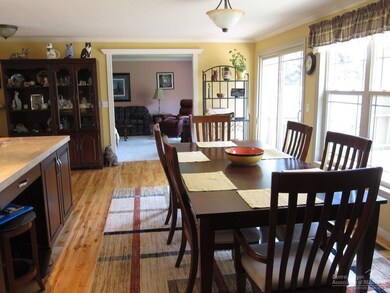
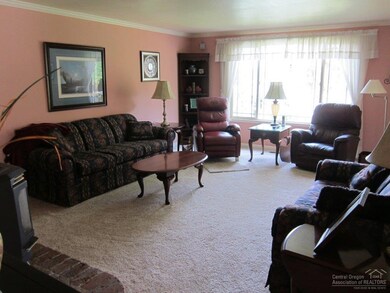
This private oasis is a delight both inside & out, just minutes from town. Immaculate with an updated kitchen, hardwood floors, newer carpet, new windows & more this home lives large & offers lots of room for big gatherings. Enjoy the peace & tranquility of the beautifully landscaped yard, fish pond/stream, big back deck & pergola or the fenced garden areas & raised beds. If you are looking for your own slice of heaven, then don't miss seeing this home. It has a lot to offer. Plenty of room to add a shop.
Last Agent to Sell the Property
Windermere Realty Trust License #910600248 Listed on: 06/15/2018
Last Buyer's Agent
Kristin Walker
Fred Real Estate Group License #930900194
| Date | Buyer | Sale Price | Title Company |
|---|---|---|---|
| Ott Amy L | $409,000 | First American Title |
| Date | Status | Borrower | Loan Amount |
|---|---|---|---|
| Open | Ott Amy L | $351,000 |
| Date | Event | Price | List to Sale | Price per Sq Ft |
|---|---|---|---|---|
| 07/16/2018 07/16/18 | Sold | $409,000 | 0.0% | $262 / Sq Ft |
| 06/18/2018 06/18/18 | Pending | -- | -- | -- |
| 06/15/2018 06/15/18 | For Sale | $409,000 | -- | $262 / Sq Ft |
| Year | Tax Paid | Tax Assessment Tax Assessment Total Assessment is a certain percentage of the fair market value that is determined by local assessors to be the total taxable value of land and additions on the property. | Land | Improvement |
|---|---|---|---|---|
| 2025 | $3,874 | $229,060 | -- | -- |
| 2024 | $3,703 | $222,390 | -- | -- |
| 2023 | $3,530 | $215,920 | $0 | $0 |
| 2022 | $3,143 | $203,540 | $0 | $0 |
| 2021 | $3,142 | $197,620 | $0 | $0 |
| 2020 | $2,990 | $197,620 | $0 | $0 |
| 2019 | $2,851 | $191,870 | $0 | $0 |
| 2018 | $2,782 | $186,290 | $0 | $0 |
| 2017 | $2,720 | $180,870 | $0 | $0 |
| 2016 | $2,688 | $175,610 | $0 | $0 |
| 2015 | $2,605 | $170,500 | $0 | $0 |
| 2014 | $2,536 | $165,540 | $0 | $0 |
Seller's Agent in 2018
Barbara Myers
Windermere Realty Trust
(541) 480-7183
62 Total Sales
K
Buyer's Agent in 2018
Kristin Walker
Fred Real Estate Group
Source: Oregon Datashare
MLS Number: 201806016
APN: 128598
Disclaimer: Certain information contained herein is derived from information provided by parties other than Homes.com. All information provided is deemed reliable, but is not guaranteed to be accurate and should be independently verified.
![]() © 2025 Oregon Datashare (KCAR | MLSCO | SOMLS). All rights reserved. The data relating to real estate for sale on this web site comes in part from the Internet Data Exchange Program of the Oregon Datashare. Real estate listings held by IDX Brokerage firms other than Ten-X are marked with the Internet Data Exchange logo or the Internet Data Exchange thumbnail logo and detailed information about them includes the name of the listing Brokers. Information provided is for consumers' personal, non-commercial use and may not be used for any purpose other than to identify prospective properties the viewer may be interested in purchasing. The consumer will not copy, retransmit nor redistribute any of the content from this website. Information provided is deemed reliable, but not guaranteed.
© 2025 Oregon Datashare (KCAR | MLSCO | SOMLS). All rights reserved. The data relating to real estate for sale on this web site comes in part from the Internet Data Exchange Program of the Oregon Datashare. Real estate listings held by IDX Brokerage firms other than Ten-X are marked with the Internet Data Exchange logo or the Internet Data Exchange thumbnail logo and detailed information about them includes the name of the listing Brokers. Information provided is for consumers' personal, non-commercial use and may not be used for any purpose other than to identify prospective properties the viewer may be interested in purchasing. The consumer will not copy, retransmit nor redistribute any of the content from this website. Information provided is deemed reliable, but not guaranteed.