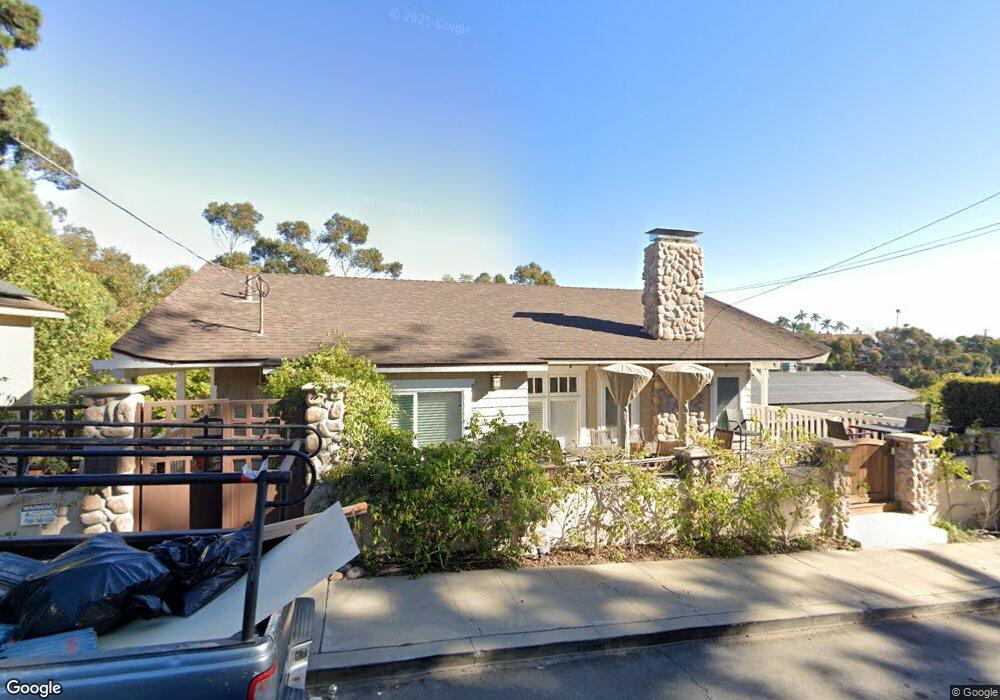
3911 Saint James Place San Diego, CA 92103
Mission Hills NeighborhoodEstimated Value: $2,110,000 - $2,478,000
5
Beds
3
Baths
2,030
Sq Ft
$1,140/Sq Ft
Est. Value
About This Home
This home is located at 3911 Saint James Place, San Diego, CA 92103 and is currently estimated at $2,313,339, approximately $1,139 per square foot. 3911 Saint James Place is a home located in San Diego County with nearby schools including Grant K-8, Richard Henry Dana Middle School, and Roosevelt International Middle School.
Ownership History
Date
Name
Owned For
Owner Type
Purchase Details
Closed on
Jul 20, 2017
Sold by
Gradwohl Judy and Gradwohl Judy Ann
Bought by
Gradwohl Judy Ann
Current Estimated Value
Purchase Details
Closed on
Apr 20, 2016
Sold by
Vander Lee Claire D and Tract Marc M
Bought by
Gradhwohl Judy
Home Financials for this Owner
Home Financials are based on the most recent Mortgage that was taken out on this home.
Original Mortgage
$939,000
Outstanding Balance
$746,712
Interest Rate
3.71%
Mortgage Type
New Conventional
Estimated Equity
$1,566,627
Purchase Details
Closed on
Dec 15, 2008
Sold by
Murr Ryan A and Murr Heather S
Bought by
Vander Lee Claire Deeks and Tract Marc
Purchase Details
Closed on
Nov 16, 2000
Sold by
Marjory F Franklin William C Mwns
Bought by
Murr Ryan A and Murr Heather S
Home Financials for this Owner
Home Financials are based on the most recent Mortgage that was taken out on this home.
Original Mortgage
$454,000
Interest Rate
7.86%
Purchase Details
Closed on
May 15, 1995
Sold by
Thornton Lee
Bought by
Franklin William C
Create a Home Valuation Report for This Property
The Home Valuation Report is an in-depth analysis detailing your home's value as well as a comparison with similar homes in the area
Home Values in the Area
Average Home Value in this Area
Purchase History
| Date | Buyer | Sale Price | Title Company |
|---|---|---|---|
| Gradwohl Judy Ann | -- | None Available | |
| Gradhwohl Judy | $1,436,500 | Fidelity National Title | |
| Vander Lee Claire Deeks | $1,038,500 | None Available | |
| Murr Ryan A | $567,500 | Fidelity National Title | |
| Franklin William C | -- | -- |
Source: Public Records
Mortgage History
| Date | Status | Borrower | Loan Amount |
|---|---|---|---|
| Open | Gradhwohl Judy | $939,000 | |
| Previous Owner | Murr Ryan A | $454,000 | |
| Closed | Murr Ryan A | $85,100 |
Source: Public Records
Tax History Compared to Growth
Tax History
| Year | Tax Paid | Tax Assessment Tax Assessment Total Assessment is a certain percentage of the fair market value that is determined by local assessors to be the total taxable value of land and additions on the property. | Land | Improvement |
|---|---|---|---|---|
| 2025 | $20,423 | $1,700,517 | $1,302,174 | $398,343 |
| 2024 | $20,423 | $1,667,175 | $1,276,642 | $390,533 |
| 2023 | $19,972 | $1,634,486 | $1,251,610 | $382,876 |
| 2022 | $19,439 | $1,602,438 | $1,227,069 | $375,369 |
| 2021 | $19,305 | $1,571,018 | $1,203,009 | $368,009 |
| 2020 | $19,069 | $1,554,910 | $1,190,674 | $364,236 |
| 2019 | $18,727 | $1,524,423 | $1,167,328 | $357,095 |
| 2018 | $17,505 | $1,494,534 | $1,144,440 | $350,094 |
| 2017 | $17,088 | $1,465,230 | $1,122,000 | $343,230 |
| 2016 | $13,213 | $1,129,686 | $871,358 | $258,328 |
| 2015 | $13,017 | $1,112,718 | $858,270 | $254,448 |
| 2014 | $12,810 | $1,090,922 | $841,458 | $249,464 |
Source: Public Records
Map
Nearby Homes
- 1864 Sunset Blvd
- 3770 Keating St
- 3903 California St Unit 3
- 4232 Arden Way
- 2045 W California St
- 3625 Keating St Unit 4
- 1806 Mckee St Unit A2
- 1806 Mckee St Unit A9
- 1753 W Lewis St
- 1860 W Montecito Way
- 1694 Torrance St
- 2111 W California St
- 1695 Neale St
- 1728 W Lewis St
- 3519 Andrews St
- 2120 Pine St
- 3975 Hortensia St Unit E1
- 3975 Hortensia St Unit E7
- 3961 Hortensia St Unit H4
- 2147 Pine St
- 3933 Saint James Place
- 3901 Saint James Place
- 3902 Alameda Dr
- 3985 Clark St
- 3912 Saint James Place
- 3939 Saint James Place
- 3920 Alameda Dr
- 4031 Bay View Ct
- 3975 Clark St
- 1900 Alameda Terrace
- 1918 Alameda Terrace
- 3928 Alameda Dr
- 3955 Saint James Place
- 4209-4221 W Third St
- 1875 Lyndon Rd
- 4017 Henry St
- 4007 Henry St
- 1855 Lyndon Rd
- 4001 Henry St
- 3959 Clark St