3911 Stock Rd SW Monroe, GA 30656
Highlights
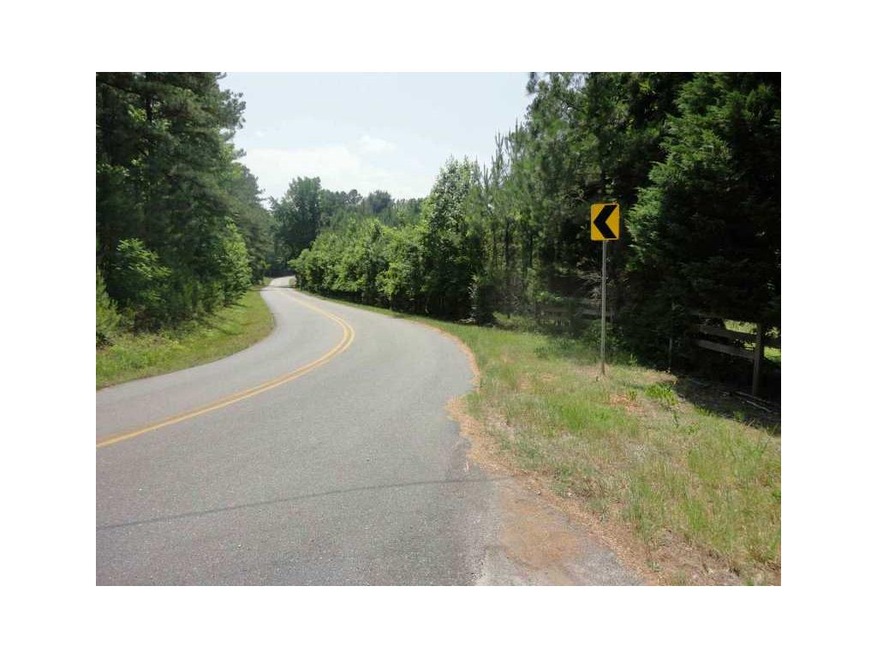
- 3.37 Acre Lot
- Partially Wooded Lot
- Level Lot
About This Lot
As of January 2020Very beautiful setting over 3 acres mostly wooded tract this land is ready to build your dream home. You can live within 30 minutes of Atlanta, Stone Mountain, or Athens. this land is priced to sell. Make offer!

Last Buyer's Agent
NON-MLS NMLS
Non FMLS Member
Property Details
Property Type
- Land
Year Built
- Built in 1972
Lot Details
- 3.37 Acre Lot
- Level Lot
- Partially Wooded Lot
- Landscaped with Trees
- Property is zoned A1
Schools
- Monroe Elementary School
- Carver Middle School
- Monroe Area High School
Utilities
- Well
- Septic Tank
- Phone Available
Listing and Financial Details
- Tax Lot 2
- Assessor Parcel Number 3911StockRD
Ownership History
Purchase Details
Purchase Details
Purchase Details
Map
Home Values in the Area
Average Home Value in this Area
Purchase History
| Date | Type | Sale Price | Title Company |
|---|---|---|---|
| Limited Warranty Deed | -- | -- | |
| Foreclosure Deed | $234,347 | -- | |
| Warranty Deed | $158,000 | -- |
Mortgage History
| Date | Status | Loan Amount | Loan Type |
|---|---|---|---|
| Previous Owner | $16,427 | Stand Alone Refi Refinance Of Original Loan |
Property History
| Date | Event | Price | Change | Sq Ft Price |
|---|---|---|---|---|
| 01/21/2020 01/21/20 | Sold | $142,768 | -0.4% | $48 / Sq Ft |
| 11/22/2019 11/22/19 | Pending | -- | -- | -- |
| 11/14/2019 11/14/19 | For Sale | $143,300 | 0.0% | $48 / Sq Ft |
| 11/12/2019 11/12/19 | Pending | -- | -- | -- |
| 11/01/2019 11/01/19 | Price Changed | $143,300 | -7.2% | $48 / Sq Ft |
| 10/03/2019 10/03/19 | Price Changed | $154,400 | -15.1% | $52 / Sq Ft |
| 09/10/2019 09/10/19 | Price Changed | $181,800 | -19.8% | $61 / Sq Ft |
| 08/26/2019 08/26/19 | For Sale | $226,700 | +907.6% | $76 / Sq Ft |
| 05/14/2012 05/14/12 | Sold | $22,500 | -25.0% | -- |
| 04/30/2012 04/30/12 | Pending | -- | -- | -- |
| 06/01/2011 06/01/11 | For Sale | $30,000 | -- | -- |
Tax History
| Year | Tax Paid | Tax Assessment Tax Assessment Total Assessment is a certain percentage of the fair market value that is determined by local assessors to be the total taxable value of land and additions on the property. | Land | Improvement |
|---|---|---|---|---|
| 2024 | $2,703 | $91,680 | $91,680 | $0 |
| 2023 | $2,641 | $87,080 | $87,080 | $0 |
| 2022 | $2,578 | $81,520 | $81,520 | $0 |
| 2021 | $2,064 | $63,360 | $63,360 | $0 |
| 2020 | $1,838 | $55,000 | $55,000 | $0 |
| 2019 | $1,691 | $48,880 | $48,880 | $0 |
| 2018 | $1,635 | $48,880 | $48,880 | $0 |
| 2017 | $3,674 | $106,640 | $49,680 | $56,960 |
| 2016 | $3,263 | $98,600 | $47,160 | $51,440 |
| 2015 | $3,173 | $94,440 | $47,160 | $47,280 |
| 2014 | $2,952 | $85,920 | $36,240 | $49,680 |
Source: First Multiple Listing Service (FMLS)
MLS Number: 4230310
APN: C072000000047000
Disclaimer: Certain information contained herein is derived from information provided by parties other than Homes.com. All information provided is deemed reliable, but is not guaranteed to be accurate and should be independently verified.
![]() Listings identified with the FMLS IDX logo come from FMLS and are held by brokerage firms other than the owner of this website. The listing brokerage is identified in any listing details. Information is deemed reliable but is not guaranteed. If you believe any FMLS listing contains material that infringes your copyrighted work please visit www.fmls.com/dmca to review our DMCA policy and learn how to submit a takedown request. © 2025 First Multiple Listing Service, Inc.
Listings identified with the FMLS IDX logo come from FMLS and are held by brokerage firms other than the owner of this website. The listing brokerage is identified in any listing details. Information is deemed reliable but is not guaranteed. If you believe any FMLS listing contains material that infringes your copyrighted work please visit www.fmls.com/dmca to review our DMCA policy and learn how to submit a takedown request. © 2025 First Multiple Listing Service, Inc.