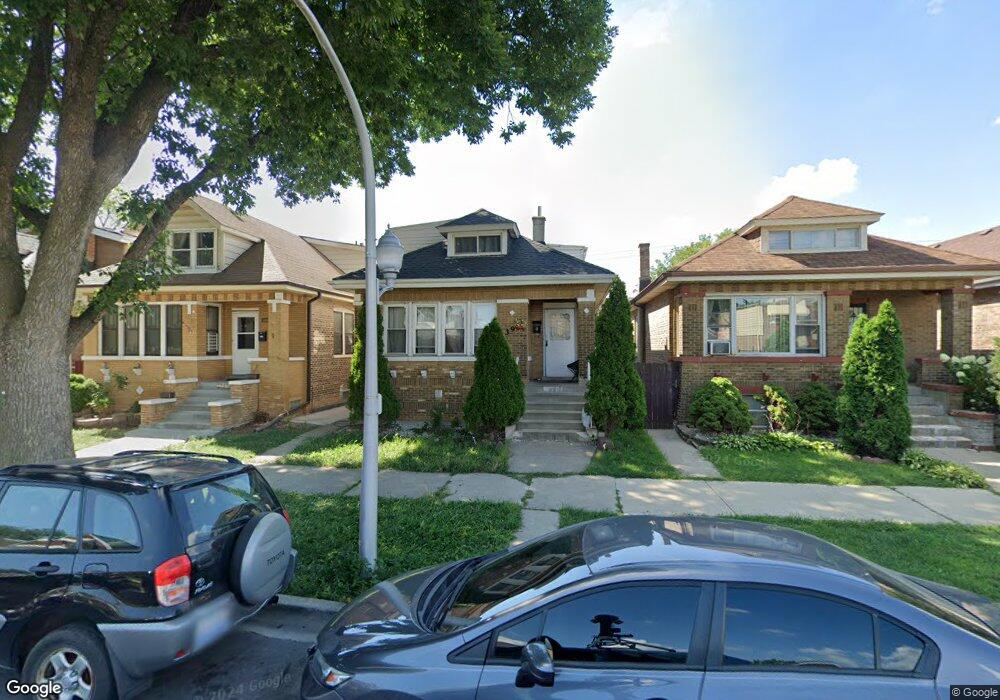
3911 W 62nd Place Chicago, IL 60629
West Lawn NeighborhoodEstimated Value: $273,000 - $375,000
3
Beds
2
Baths
1,836
Sq Ft
$180/Sq Ft
Est. Value
About This Home
This home is located at 3911 W 62nd Place, Chicago, IL 60629 and is currently estimated at $329,599, approximately $179 per square foot. 3911 W 62nd Place is a home located in Cook County with nearby schools including Peck Elementary School, Richardson Middle School, and Hubbard High School.
Ownership History
Date
Name
Owned For
Owner Type
Purchase Details
Closed on
Feb 11, 2023
Sold by
Ortiz-Moreno Nelinda and Martinez Moises Diaz
Bought by
Ortiz Yesenia
Current Estimated Value
Purchase Details
Closed on
Apr 21, 2003
Sold by
Martinez Moises Diaz and Moreno Nelinda
Bought by
Martinez Moises Diaz
Purchase Details
Closed on
Jan 10, 2002
Sold by
Chaidez Emilio G and Chaidez Faustino
Bought by
Martinez Moises Diaz and Moreno Nelinda
Home Financials for this Owner
Home Financials are based on the most recent Mortgage that was taken out on this home.
Original Mortgage
$140,632
Interest Rate
6.92%
Mortgage Type
FHA
Purchase Details
Closed on
Jul 17, 2001
Sold by
Perez Victor M and Urquiza Perez Maria G
Bought by
Chaidez Emilio G and Chaidez Faustino
Home Financials for this Owner
Home Financials are based on the most recent Mortgage that was taken out on this home.
Original Mortgage
$114,300
Interest Rate
7.16%
Mortgage Type
Balloon
Create a Home Valuation Report for This Property
The Home Valuation Report is an in-depth analysis detailing your home's value as well as a comparison with similar homes in the area
Home Values in the Area
Average Home Value in this Area
Purchase History
| Date | Buyer | Sale Price | Title Company |
|---|---|---|---|
| Ortiz Yesenia | -- | None Listed On Document | |
| Martinez Moises Diaz | -- | -- | |
| Martinez Moises Diaz | -- | -- | |
| Martinez Moises Diaz | $146,000 | Chicago Title Insurance Co | |
| Chaidez Emilio G | $127,000 | Chicago Title Insurance Co |
Source: Public Records
Mortgage History
| Date | Status | Borrower | Loan Amount |
|---|---|---|---|
| Previous Owner | Martinez Moises Diaz | $140,632 | |
| Previous Owner | Chaidez Emilio G | $114,300 |
Source: Public Records
Tax History Compared to Growth
Tax History
| Year | Tax Paid | Tax Assessment Tax Assessment Total Assessment is a certain percentage of the fair market value that is determined by local assessors to be the total taxable value of land and additions on the property. | Land | Improvement |
|---|---|---|---|---|
| 2024 | $3,613 | $26,000 | $2,880 | $23,120 |
| 2023 | $3,484 | $23,000 | $3,600 | $19,400 |
| 2022 | $3,484 | $23,000 | $3,600 | $19,400 |
| 2021 | $3,955 | $23,000 | $3,600 | $19,400 |
| 2020 | $3,281 | $17,733 | $3,600 | $14,133 |
| 2019 | $3,335 | $19,925 | $3,600 | $16,325 |
| 2018 | $3,278 | $19,925 | $3,600 | $16,325 |
| 2017 | $3,673 | $20,326 | $3,240 | $17,086 |
| 2016 | $3,594 | $20,326 | $3,240 | $17,086 |
| 2015 | $3,268 | $20,326 | $3,240 | $17,086 |
| 2014 | $2,770 | $17,380 | $3,060 | $14,320 |
| 2013 | $2,704 | $17,380 | $3,060 | $14,320 |
Source: Public Records
Map
Nearby Homes
- 3914 W 63rd St Unit 3B
- 6235 S Komensky Ave
- 3817 W 61st Place
- 3801 W 63rd Place
- 3751 W 63rd Place
- 3817 W 61st St
- 3909 W 60th Place
- 3700 W 63rd St
- 6330 S Karlov Ave
- 6235 S Kedvale Ave
- 3757 W 65th St
- 3710 W 60th Place
- 3617 W 63rd Place
- 3651 W 64th Place
- 3745 W 59th Place
- 6148 S Tripp Ave
- 3709 W 59th Place
- 4015 W 59th St
- 3912 W 59th St
- 3529 W 63rd Place
- 3915 W 62nd Place
- 3905 W 62nd Place
- 3919 W 62nd Place
- 3901 W 62nd Place
- 3923 W 62nd Place
- 3910 W 63rd St Unit P6
- 3910 W 63rd St Unit 1B
- 3910 W 63rd St Unit P4
- 3910 W 63rd St Unit P3
- 3910 W 63rd St Unit 3C
- 3910 W 63rd St Unit 2C
- 3910 W 63rd St Unit 2B
- 3910 W 63rd St Unit 1C
- 3910 W 63rd St Unit 3A
- 3910 W 63rd St Unit 3B
- 3910 W 63rd St Unit 1A
- 3910 W 63rd St Unit P2
- 3910 W 63rd St Unit P1
- 3910 W 63rd St Unit P5
- 3910 W 63rd St Unit 2A