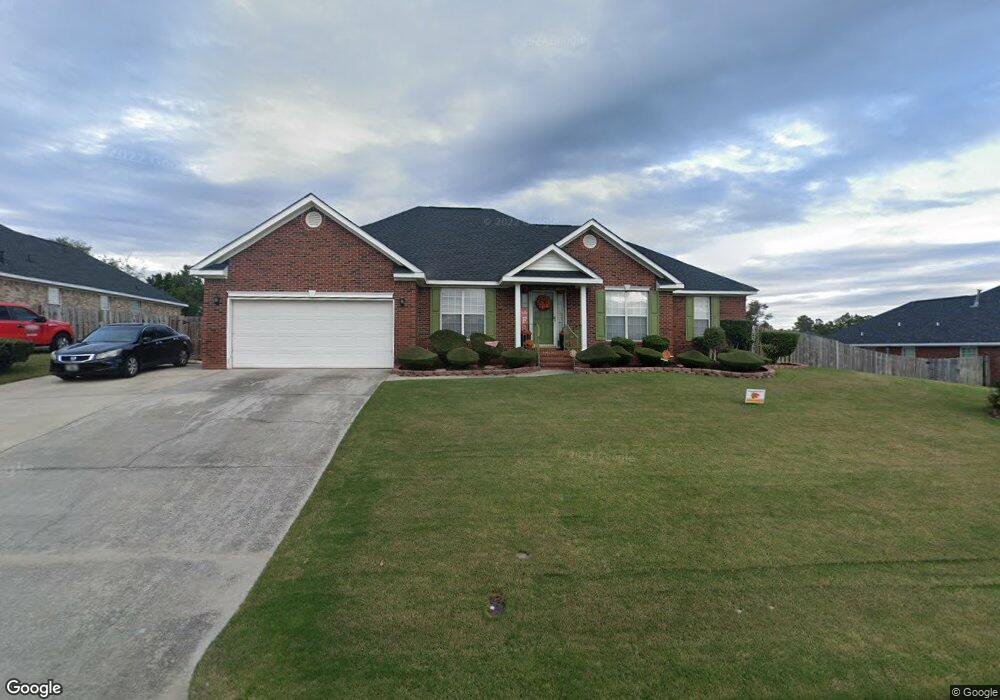
3912 Barnett Crossing Augusta, GA 30909
Belair NeighborhoodEstimated Value: $266,000 - $302,004
4
Beds
3
Baths
2,110
Sq Ft
$136/Sq Ft
Est. Value
About This Home
This home is located at 3912 Barnett Crossing, Augusta, GA 30909 and is currently estimated at $287,501, approximately $136 per square foot. 3912 Barnett Crossing is a home located in Richmond County with nearby schools including Sue Reynolds Elementary School, Langford Middle School, and Johnson Magnet.
Ownership History
Date
Name
Owned For
Owner Type
Purchase Details
Closed on
Oct 20, 2021
Sold by
Wilson Dorothy B
Bought by
Wilson Charles R and Wilson Margaret G
Current Estimated Value
Purchase Details
Closed on
Jan 13, 2003
Sold by
Wilson Dorothy B
Bought by
Wilson Dorothy B and Wilson Charles R
Home Financials for this Owner
Home Financials are based on the most recent Mortgage that was taken out on this home.
Original Mortgage
$113,500
Interest Rate
6.16%
Purchase Details
Closed on
May 15, 2002
Sold by
Home Sites Ltd
Bought by
Keystone Homes Inc
Home Financials for this Owner
Home Financials are based on the most recent Mortgage that was taken out on this home.
Original Mortgage
$101,900
Interest Rate
7.12%
Mortgage Type
Construction
Create a Home Valuation Report for This Property
The Home Valuation Report is an in-depth analysis detailing your home's value as well as a comparison with similar homes in the area
Home Values in the Area
Average Home Value in this Area
Purchase History
| Date | Buyer | Sale Price | Title Company |
|---|---|---|---|
| Wilson Charles R | -- | -- | |
| Wilson Dorothy B | -- | -- | |
| Wilson Dorothy B | $141,900 | -- | |
| Keystone Homes Inc | $18,900 | -- |
Source: Public Records
Mortgage History
| Date | Status | Borrower | Loan Amount |
|---|---|---|---|
| Previous Owner | Wilson Dorothy B | $113,500 | |
| Previous Owner | Keystone Homes Inc | $101,900 | |
| Closed | Wilson Dorothy B | $21,300 |
Source: Public Records
Tax History Compared to Growth
Tax History
| Year | Tax Paid | Tax Assessment Tax Assessment Total Assessment is a certain percentage of the fair market value that is determined by local assessors to be the total taxable value of land and additions on the property. | Land | Improvement |
|---|---|---|---|---|
| 2024 | -- | $109,256 | $15,600 | $93,656 |
| 2023 | $2,681 | $106,548 | $15,600 | $90,948 |
| 2022 | $3,056 | $94,987 | $15,600 | $79,387 |
| 2021 | $2,715 | $75,481 | $15,600 | $59,881 |
| 2020 | $2,671 | $75,481 | $15,600 | $59,881 |
| 2019 | $2,589 | $67,792 | $14,800 | $52,992 |
| 2018 | $2,607 | $67,792 | $14,800 | $52,992 |
| 2017 | $2,571 | $67,829 | $14,800 | $53,029 |
| 2016 | $2,573 | $67,829 | $14,800 | $53,029 |
| 2015 | $2,591 | $67,829 | $14,800 | $53,029 |
| 2014 | $2,586 | $67,608 | $14,800 | $52,808 |
Source: Public Records
Map
Nearby Homes
- 3465 Camak Dr
- 3655 Crawfordville Dr
- 3650 Crawfordville Dr
- 3246 Lexington Way
- 3605 Wrightsboro Rd
- 3009 Norwood Ct
- 3314 Camak Dr
- 3312 Camak Dr
- 2928 Aylesbury Dr
- 5226 Aruba Cir
- 5149 Wheeler Lake Rd
- 4086 Harper Franklin Ave
- 5129 Wheeler Lake Rd
- 3416 Covington Ct
- 3736 Wrightsboro Rd
- 3422 Covington Ct
- 729 Holderness Ct
- 1133 Brookstone Way
- 1125 Brookstone Way
- 3233 Peninsula Dr
- 3910 Barnett Crossing
- 3914 Barnett Crossing
- 3995 Madison Ln
- 3993 Madison Ln
- 3908 Barnett Crossing
- 3991 Madison Ln
- 3919 Barnett Crossing
- 3915 Barnett Crossing
- 3994 Madison Ln
- 3913 Barnett Crossing
- 3911 Barnett Crossing
- 3992 Madison Ln
- 2926 Eidson Dr
- 3989 Madison Ln
- 4003 Madison Ln
- 3996 Madison Ln
- 3909 Barnett Crossing
- 3990 Madison Ln
- 3998 Madison Ln
- 3987 Madison Ln