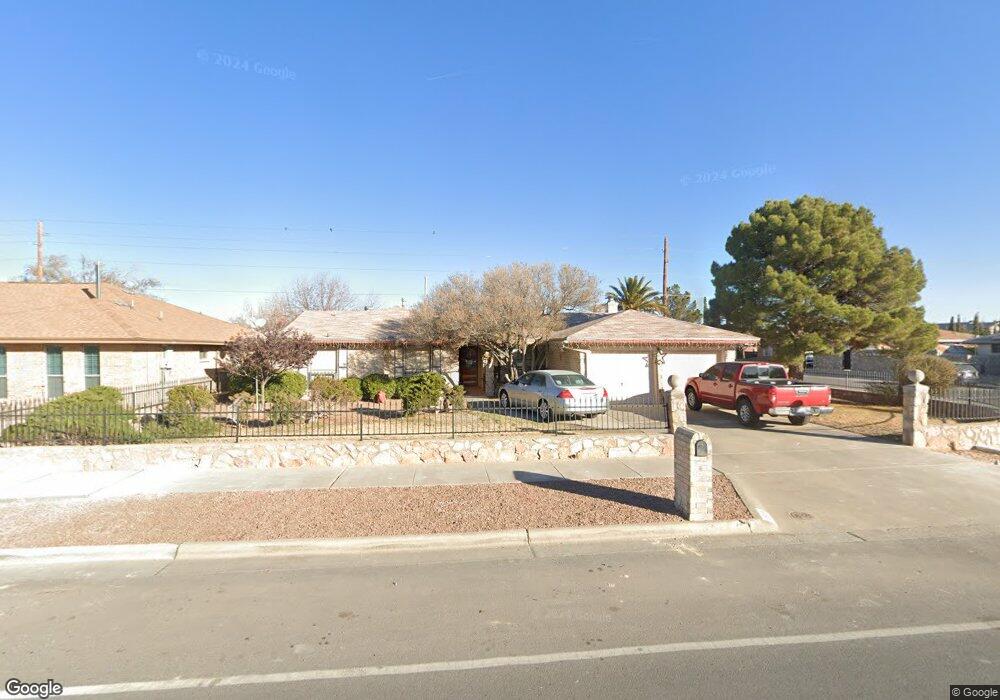
3913 Breckenridge Dr El Paso, TX 79936
Indian Ridge NeighborhoodEstimated Value: $290,000 - $332,000
3
Beds
3
Baths
2,090
Sq Ft
$146/Sq Ft
Est. Value
About This Home
This home is located at 3913 Breckenridge Dr, El Paso, TX 79936 and is currently estimated at $304,323, approximately $145 per square foot. 3913 Breckenridge Dr is a home located in El Paso County with nearby schools including Pebble Hills Elementary School, J.M. Hanks Middle School, and J M Hanks High School.
Ownership History
Date
Name
Owned For
Owner Type
Purchase Details
Closed on
Aug 15, 2005
Sold by
Nunez Juan and Nunez Heidi H
Bought by
Barrientos Juan A and Barrientos Grace S
Current Estimated Value
Home Financials for this Owner
Home Financials are based on the most recent Mortgage that was taken out on this home.
Original Mortgage
$142,000
Outstanding Balance
$74,547
Interest Rate
5.65%
Mortgage Type
Fannie Mae Freddie Mac
Estimated Equity
$229,776
Purchase Details
Closed on
Sep 1, 1998
Sold by
Nevins Richard and Nevins Michele R Gorman
Bought by
Nunez Juan and Nunez Heidi
Home Financials for this Owner
Home Financials are based on the most recent Mortgage that was taken out on this home.
Original Mortgage
$70,000
Interest Rate
6.94%
Purchase Details
Closed on
May 20, 1996
Sold by
Beltran Emilio G and Beltran Alice L
Bought by
Nunez Juan and Nunez Heidi H
Home Financials for this Owner
Home Financials are based on the most recent Mortgage that was taken out on this home.
Original Mortgage
$66,450
Interest Rate
8.06%
Mortgage Type
VA
Create a Home Valuation Report for This Property
The Home Valuation Report is an in-depth analysis detailing your home's value as well as a comparison with similar homes in the area
Home Values in the Area
Average Home Value in this Area
Purchase History
| Date | Buyer | Sale Price | Title Company |
|---|---|---|---|
| Barrientos Juan A | -- | -- | |
| Nunez Juan | -- | -- | |
| Nunez Juan | -- | -- |
Source: Public Records
Mortgage History
| Date | Status | Borrower | Loan Amount |
|---|---|---|---|
| Open | Barrientos Juan A | $142,000 | |
| Previous Owner | Nunez Juan | $70,000 | |
| Previous Owner | Nunez Juan | $66,450 |
Source: Public Records
Tax History Compared to Growth
Tax History
| Year | Tax Paid | Tax Assessment Tax Assessment Total Assessment is a certain percentage of the fair market value that is determined by local assessors to be the total taxable value of land and additions on the property. | Land | Improvement |
|---|---|---|---|---|
| 2025 | $4,541 | $311,742 | -- | -- |
| 2024 | $4,541 | $283,402 | $29,533 | $253,869 |
| 2023 | $4,468 | $258,456 | $0 | $0 |
| 2022 | $7,296 | $234,960 | $0 | $0 |
| 2021 | $6,943 | $213,600 | $29,533 | $184,067 |
| 2020 | $6,250 | $197,882 | $22,994 | $174,888 |
| 2018 | $5,484 | $176,343 | $22,994 | $153,349 |
| 2017 | $5,227 | $171,010 | $22,994 | $148,016 |
| 2016 | $5,227 | $171,010 | $22,994 | $148,016 |
| 2015 | $4,179 | $171,010 | $22,994 | $148,016 |
| 2014 | $4,179 | $171,518 | $22,994 | $148,524 |
Source: Public Records
Map
Nearby Homes
- 11189 Childress Ave
- 3651 George Dieter Dr
- 11254 Montana Ave
- 11165 Shiner Ave
- 11298 Montana Ave
- 11272 Ivanhoe Dr
- 11273 Ivanhoe Dr
- 3428 Itasca St
- 11025 Sunshine Ct
- 11016 Aqua Ct
- 3332 Mclean St
- 11334 Jasso Ct
- 11337 Ardelle Ave
- 11338 Jasso
- 11342 Jasso
- 3352 Broken Bow St
- 11346 Jasso Ct
- 11312 Ardelle Ave
- 3309 Broken Bow St
- 11549 MacAw Palm Dr
- 3909 Breckenridge Dr
- 3605 Red Cloud Place
- 3921 Breckenridge Dr
- 3905 Breckenridge Dr
- 3609 Red Cloud Place
- 3912 Breckenridge Dr
- 3604 Red Cloud Place
- 3916 Breckenridge Dr
- 3908 Breckenridge Dr
- 3925 Breckenridge Dr
- 3920 Breckenridge Dr
- 3608 Red Cloud Place
- 3613 Red Cloud Place
- 3904 Breckenridge Dr
- 3901 Breckenridge Dr
- 3924 Breckenridge Dr
- 11213 Signal Ridge Dr
- 3929 Breckenridge Dr
- 11217 Signal Ridge Dr
- 3612 Red Cloud Place