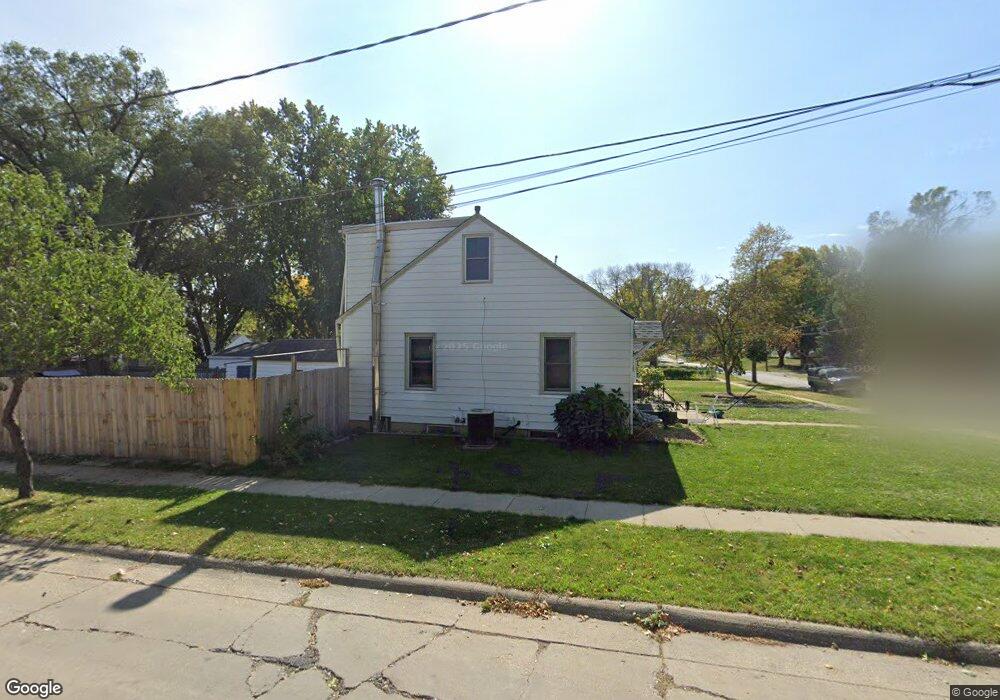
3913 E 8th St Des Moines, IA 50316
Highland Park NeighborhoodEstimated Value: $162,000 - $216,000
4
Beds
2
Baths
1,409
Sq Ft
$134/Sq Ft
Est. Value
About This Home
This home is located at 3913 E 8th St, Des Moines, IA 50316 and is currently estimated at $188,119, approximately $133 per square foot. 3913 E 8th St is a home located in Polk County with nearby schools including Madison Elementary School, Harding Middle School, and North High School.
Ownership History
Date
Name
Owned For
Owner Type
Purchase Details
Closed on
Nov 1, 2013
Sold by
Tenborg Jonathan
Bought by
Tenborg Jonathan and Tenborg Nicole
Current Estimated Value
Purchase Details
Closed on
Oct 15, 2010
Sold by
Smith Nathan
Bought by
Tenborg Jonathan
Home Financials for this Owner
Home Financials are based on the most recent Mortgage that was taken out on this home.
Original Mortgage
$86,463
Interest Rate
4.87%
Mortgage Type
FHA
Purchase Details
Closed on
Aug 29, 2009
Sold by
Ott Kevin and Ott Angela
Bought by
3913 E 8Th St Trust and Smith Nathan
Purchase Details
Closed on
Apr 16, 2008
Sold by
Gray Chris W and Carper Natalie N
Bought by
Ott Kevin and Ott Angela
Home Financials for this Owner
Home Financials are based on the most recent Mortgage that was taken out on this home.
Original Mortgage
$118,539
Interest Rate
6.09%
Mortgage Type
FHA
Purchase Details
Closed on
Jun 27, 2003
Sold by
Barker Helen E and Barker Douglas B
Bought by
Gray Chris W and Carper Natalie N
Home Financials for this Owner
Home Financials are based on the most recent Mortgage that was taken out on this home.
Original Mortgage
$98,000
Interest Rate
7.35%
Mortgage Type
Purchase Money Mortgage
Create a Home Valuation Report for This Property
The Home Valuation Report is an in-depth analysis detailing your home's value as well as a comparison with similar homes in the area
Home Values in the Area
Average Home Value in this Area
Purchase History
| Date | Buyer | Sale Price | Title Company |
|---|---|---|---|
| Tenborg Jonathan | -- | None Available | |
| Tenborg Jonathan | $87,500 | None Available | |
| 3913 E 8Th St Trust | $60,500 | None Available | |
| 3913 E 8Th St Trust | -- | None Available | |
| Ott Kevin | $120,000 | Itc | |
| Gray Chris W | $97,500 | -- |
Source: Public Records
Mortgage History
| Date | Status | Borrower | Loan Amount |
|---|---|---|---|
| Previous Owner | Tenborg Jonathan | $86,463 | |
| Previous Owner | Ott Kevin | $118,539 | |
| Previous Owner | Gray Chris W | $98,000 |
Source: Public Records
Tax History
| Year | Tax Paid | Tax Assessment Tax Assessment Total Assessment is a certain percentage of the fair market value that is determined by local assessors to be the total taxable value of land and additions on the property. | Land | Improvement |
|---|---|---|---|---|
| 2025 | $2,950 | $182,100 | $32,000 | $150,100 |
| 2024 | $2,950 | $160,400 | $27,800 | $132,600 |
| 2023 | $3,024 | $160,400 | $27,800 | $132,600 |
| 2022 | $3,000 | $137,200 | $24,300 | $112,900 |
| 2021 | $2,824 | $137,200 | $24,300 | $112,900 |
| 2020 | $2,930 | $121,800 | $21,500 | $100,300 |
| 2019 | $2,784 | $121,800 | $21,500 | $100,300 |
| 2018 | $2,750 | $112,100 | $19,300 | $92,800 |
| 2017 | $2,682 | $112,100 | $19,300 | $92,800 |
| 2016 | $2,608 | $107,700 | $18,200 | $89,500 |
| 2015 | $2,608 | $107,700 | $18,200 | $89,500 |
| 2014 | $2,510 | $103,200 | $17,000 | $86,200 |
Source: Public Records
Map
Nearby Homes
- 4031 E 8th St
- 4012 Amherst St
- 3803 Bowdoin St
- 1231 Jerlynn Ave
- 3832 Bowdoin St
- 3701 Amherst St
- 4012 Bowdoin St
- 3633 Bowdoin St
- 3814 Columbia St
- 4220 NE 10th St
- 3421 Amherst St
- 3507 Bowdoin St
- 3905 Cambridge St
- 4013 Cambridge St
- 360 NE Aurora Ave
- 3615 Cambridge St
- 3221 E 12th St
- 3210 E 7th St
- 3301 Columbia St
- 3938 1st St
Your Personal Tour Guide
Ask me questions while you tour the home.