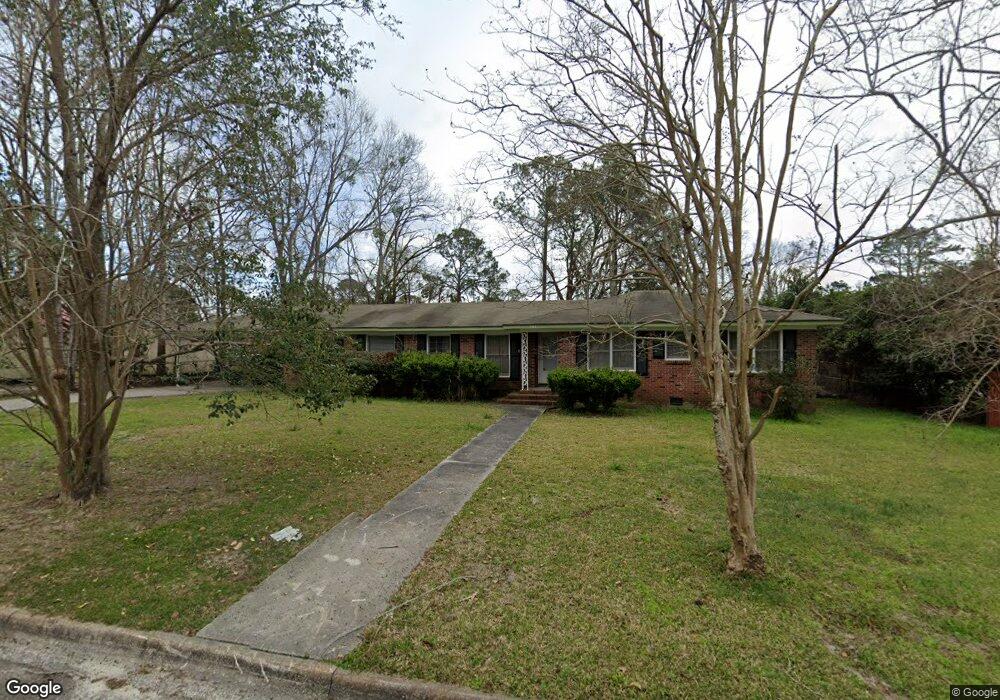
3913 Mulberry Place Valdosta, GA 31605
Estimated Value: $179,000 - $221,000
3
Beds
2
Baths
1,878
Sq Ft
$108/Sq Ft
Est. Value
About This Home
This home is located at 3913 Mulberry Place, Valdosta, GA 31605 and is currently estimated at $203,047, approximately $108 per square foot. 3913 Mulberry Place is a home located in Lowndes County with nearby schools including Dewar Elementary School, Pine Grove Middle School, and Lowndes High School.
Ownership History
Date
Name
Owned For
Owner Type
Purchase Details
Closed on
Feb 1, 2016
Sold by
Tomlinson James Leonard /Tr
Bought by
Bernard Nick
Current Estimated Value
Purchase Details
Closed on
Sep 23, 2009
Sold by
Nations Bank Of Georgia
Bought by
Tomlinson James Dariel and Bullard Mary Ruth
Purchase Details
Closed on
Oct 17, 1989
Bought by
Tomlinsom Leonard Trustee
Purchase Details
Closed on
Oct 25, 1985
Bought by
Tomlinson James Leonard and Mary Jane
Purchase Details
Closed on
Nov 15, 1984
Bought by
Moss Archie E and Moss Harlene
Purchase Details
Closed on
Nov 1, 1984
Bought by
Daily Bobby J
Purchase Details
Closed on
Aug 30, 1976
Bought by
Girardin William L
Purchase Details
Closed on
Mar 6, 1975
Bought by
Mucha Thomas J and Mucha Ellen
Purchase Details
Closed on
Nov 23, 1970
Bought by
Ray Wm D and Jeffre Agnew
Purchase Details
Closed on
Jun 27, 1969
Bought by
Keen John M and Keen Winifred
Create a Home Valuation Report for This Property
The Home Valuation Report is an in-depth analysis detailing your home's value as well as a comparison with similar homes in the area
Home Values in the Area
Average Home Value in this Area
Purchase History
| Date | Buyer | Sale Price | Title Company |
|---|---|---|---|
| Bernard Nick | $68,000 | -- | |
| Tomlinson James Dariel | -- | -- | |
| Tomlinsom Leonard Trustee | -- | -- | |
| Tomlinson James Leonard | $37,000 | -- | |
| Moss Archie E | $36,300 | -- | |
| Daily Bobby J | $36,300 | -- | |
| Girardin William L | $11,000 | -- | |
| Mucha Thomas J | $8,000 | -- | |
| Ray Wm D | $2,000 | -- | |
| Keen John M | $25,000 | -- |
Source: Public Records
Tax History Compared to Growth
Tax History
| Year | Tax Paid | Tax Assessment Tax Assessment Total Assessment is a certain percentage of the fair market value that is determined by local assessors to be the total taxable value of land and additions on the property. | Land | Improvement |
|---|---|---|---|---|
| 2024 | $1,596 | $71,322 | $6,600 | $64,722 |
| 2023 | $1,596 | $60,505 | $6,600 | $53,905 |
| 2022 | $1,083 | $43,490 | $6,600 | $36,890 |
| 2021 | $1,129 | $43,490 | $6,600 | $36,890 |
| 2020 | $1,051 | $43,490 | $6,600 | $36,890 |
| 2019 | $1,062 | $43,490 | $6,600 | $36,890 |
| 2018 | $1,072 | $43,490 | $6,600 | $36,890 |
| 2017 | $625 | $40,156 | $6,600 | $33,556 |
| 2016 | $1,163 | $40,261 | $6,600 | $33,661 |
| 2015 | $1,115 | $40,261 | $6,600 | $33,661 |
| 2014 | $1,138 | $40,261 | $6,600 | $33,661 |
Source: Public Records
Map
Nearby Homes
- 383 Camellia Dr
- 3918 Camellia Dr
- 5026 Greyfield Place N
- 3448 Bemiss Rd
- 3480 Bemiss Rd
- 4111 Oak Dr
- 4114 Oak Dr Unit 8
- 4010 Fritz Ln
- 309 Tomlinson Dr
- 646 Justin Dr
- 310 Highland Heights Dr
- 2719 2nd St N
- 4004 Tack Trail
- 1.39 ac. Bemiss Rd
- 4475 Bemiss Rd
- 3917 Pecan Dr
- 618 Justin Dr
- 3013 Kensington Ln
- 3903 Pecan Dr
- 3604 Bellhaven Dr
- 5001 Oak Dr
- 3911 Mulberry Place
- 5002 Peachtree St
- 5003 Oak Dr
- 5004 Peachtree St
- 4009 Oak Dr
- 4004 Mulberry Place
- 4014 Oak Dr
- 5005 Oak Dr
- 5001 Mulberry Place
- 5006 Peachtree St
- 5001 Peachtree St
- 4018 Oak Dr
- 5003 Peachtree St
- 4007 Oak Dr
- 5000 Oak Dr
- 4006 Oak Dr
- 5005 Peachtree St
- 5008 Peachtree St
- 5007 Peachtree St