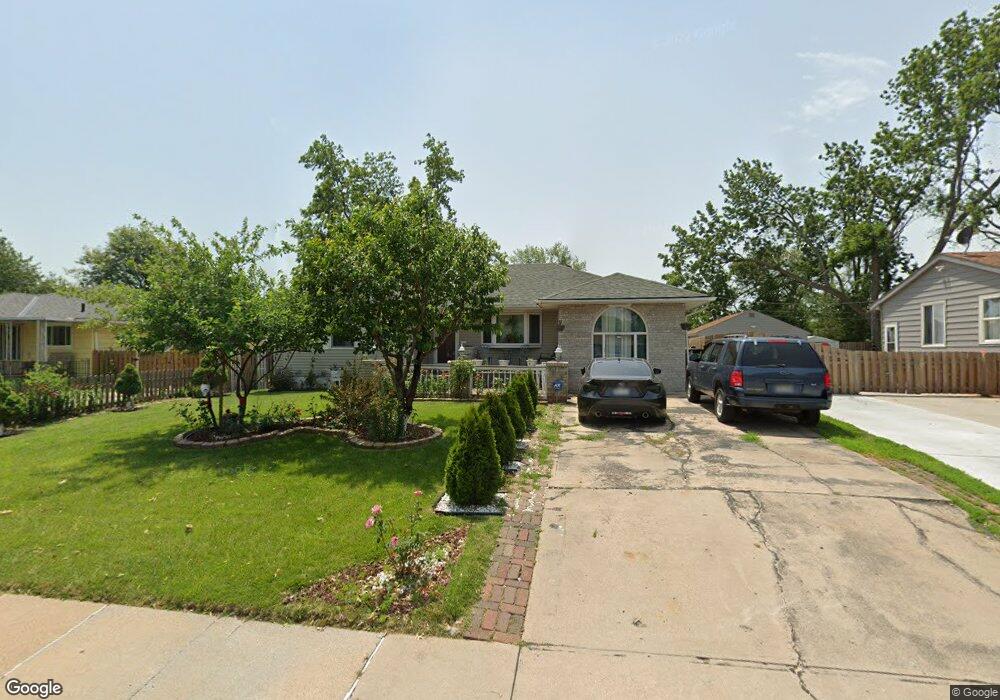
3913 Polk St Omaha, NE 68107
South Central Omaha NeighborhoodEstimated Value: $228,000 - $279,000
2
Beds
2
Baths
2,060
Sq Ft
$121/Sq Ft
Est. Value
About This Home
This home is located at 3913 Polk St, Omaha, NE 68107 and is currently estimated at $249,202, approximately $120 per square foot. 3913 Polk St is a home located in Douglas County with nearby schools including Gilder Elementary School, Bryan Middle School, and Bryan High School.
Ownership History
Date
Name
Owned For
Owner Type
Purchase Details
Closed on
Dec 1, 2010
Sold by
Hsbc Mortgage Services Inc
Bought by
Lagunas Luz and Lagunas Filiberto
Current Estimated Value
Home Financials for this Owner
Home Financials are based on the most recent Mortgage that was taken out on this home.
Original Mortgage
$95,000
Outstanding Balance
$2,119
Interest Rate
4.18%
Mortgage Type
New Conventional
Estimated Equity
$247,083
Purchase Details
Closed on
Sep 21, 2010
Sold by
Halac Brian M
Bought by
Hsbc Mortgage Services Inc
Create a Home Valuation Report for This Property
The Home Valuation Report is an in-depth analysis detailing your home's value as well as a comparison with similar homes in the area
Home Values in the Area
Average Home Value in this Area
Purchase History
| Date | Buyer | Sale Price | Title Company |
|---|---|---|---|
| Lagunas Luz | $100,000 | Superior Title & Escrow Llc | |
| Hsbc Mortgage Services Inc | -- | None Available |
Source: Public Records
Mortgage History
| Date | Status | Borrower | Loan Amount |
|---|---|---|---|
| Open | Lagunas Luz | $95,000 |
Source: Public Records
Tax History Compared to Growth
Tax History
| Year | Tax Paid | Tax Assessment Tax Assessment Total Assessment is a certain percentage of the fair market value that is determined by local assessors to be the total taxable value of land and additions on the property. | Land | Improvement |
|---|---|---|---|---|
| 2024 | $3,969 | $210,200 | $13,000 | $197,200 |
| 2023 | $3,969 | $188,100 | $13,000 | $175,100 |
| 2022 | $3,883 | $181,900 | $6,800 | $175,100 |
| 2021 | $3,729 | $176,200 | $6,800 | $169,400 |
| 2020 | $3,772 | $176,200 | $6,800 | $169,400 |
| 2019 | $3,077 | $143,300 | $6,800 | $136,500 |
| 2018 | $2,531 | $117,700 | $6,800 | $110,900 |
| 2017 | $2,543 | $117,700 | $6,800 | $110,900 |
| 2016 | $2,526 | $117,700 | $6,800 | $110,900 |
| 2015 | $2,492 | $117,700 | $6,800 | $110,900 |
| 2014 | $2,492 | $117,700 | $6,800 | $110,900 |
Source: Public Records
Map
Nearby Homes