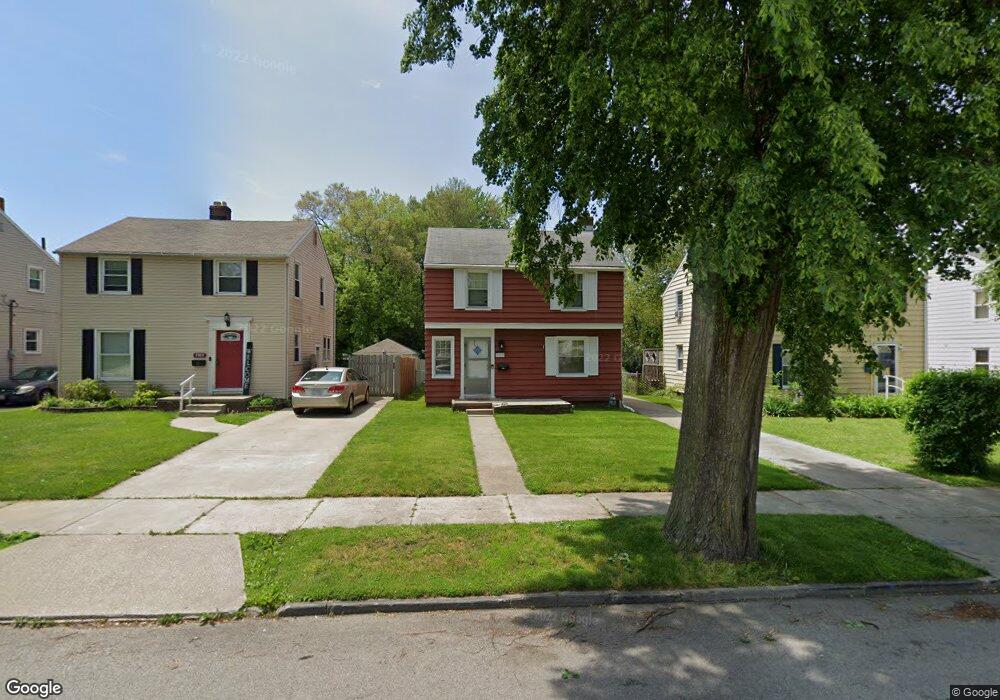
3913 Wallwerth Dr Toledo, OH 43612
Five Points Neighborhood
3
Beds
2
Baths
1,522
Sq Ft
--
Built
About This Home
This home is located at 3913 Wallwerth Dr, Toledo, OH 43612. 3913 Wallwerth Dr is a home located in Lucas County with nearby schools including Longfellow Elementary School, Start High School, and Horizon Science Academy - Toledo High School.
Ownership History
Date
Name
Owned For
Owner Type
Purchase Details
Closed on
Oct 1, 2021
Sold by
Kuron Brett C
Bought by
Goodner James A
Home Financials for this Owner
Home Financials are based on the most recent Mortgage that was taken out on this home.
Original Mortgage
$105,362
Outstanding Balance
$95,872
Interest Rate
2.8%
Mortgage Type
FHA
Purchase Details
Closed on
Aug 28, 2000
Sold by
William Klee and Rs Elaine A T
Bought by
Kuron Brett C
Home Financials for this Owner
Home Financials are based on the most recent Mortgage that was taken out on this home.
Original Mortgage
$85,719
Interest Rate
8.26%
Mortgage Type
FHA
Purchase Details
Closed on
Jul 26, 2000
Sold by
Klee William & Elaine A Trs
Bought by
Klee William and Klee Elaine A
Home Financials for this Owner
Home Financials are based on the most recent Mortgage that was taken out on this home.
Original Mortgage
$85,719
Interest Rate
8.26%
Mortgage Type
FHA
Purchase Details
Closed on
Jul 23, 1999
Sold by
Klee Klee W and Klee E A
Bought by
Klee Elaine A and Klee William
Create a Home Valuation Report for This Property
The Home Valuation Report is an in-depth analysis detailing your home's value as well as a comparison with similar homes in the area
Home Values in the Area
Average Home Value in this Area
Purchase History
| Date | Buyer | Sale Price | Title Company |
|---|---|---|---|
| Goodner James A | $109,000 | None Listed On Document | |
| Kuron Brett C | $86,200 | -- | |
| Klee William | -- | -- | |
| Klee Elaine A | -- | -- |
Source: Public Records
Mortgage History
| Date | Status | Borrower | Loan Amount |
|---|---|---|---|
| Open | Goodner James A | $105,362 | |
| Previous Owner | Kuron Brett C | $85,719 | |
| Previous Owner | Klee William | $135,000 |
Source: Public Records
Tax History Compared to Growth
Tax History
| Year | Tax Paid | Tax Assessment Tax Assessment Total Assessment is a certain percentage of the fair market value that is determined by local assessors to be the total taxable value of land and additions on the property. | Land | Improvement |
|---|---|---|---|---|
| 2024 | $889 | $29,015 | $5,845 | $23,170 |
| 2023 | $1,576 | $24,535 | $3,710 | $20,825 |
| 2022 | $1,581 | $24,535 | $3,710 | $20,825 |
| 2021 | $1,621 | $24,535 | $3,710 | $20,825 |
| 2020 | $1,768 | $23,835 | $3,570 | $20,265 |
| 2019 | $1,720 | $23,835 | $3,570 | $20,265 |
| 2018 | $1,738 | $23,835 | $3,570 | $20,265 |
| 2017 | $1,771 | $23,310 | $3,500 | $19,810 |
| 2016 | $1,767 | $66,600 | $10,000 | $56,600 |
| 2015 | $1,751 | $66,600 | $10,000 | $56,600 |
| 2014 | $1,466 | $23,310 | $3,500 | $19,810 |
| 2013 | $1,466 | $23,310 | $3,500 | $19,810 |
Source: Public Records
Map
Nearby Homes
- 3821 Jackman Rd
- 1742 Brussels St
- 3864 Almeda Dr
- 3751 Jackman Rd
- 3710 Torrance Dr
- 3846 Burton Ave
- 1749 Berdan Ave
- 1818 Barrows St
- 4037 Commonwealth Ave
- 3941 Leybourn Ave
- 1828 Brame Place
- 3802 Burton Ave
- 3640 Torrance Dr
- 1844 Berkshire Place
- 1489 Berdan Ave
- 1834 Berdan Ave
- 1665 Burgoyne Dr
- 1846 Balkan Place
- 3855 Revere Dr
- 4114 Kingsbury Ave
- 3911 Wallwerth Dr
- 3915 Wallwerth Dr
- 3909 Wallwerth Dr
- 3917 Wallwerth Dr
- 3907 Wallwerth Dr
- 3921 Wallwerth Dr
- 3903 Wallwerth Dr
- 3927 Wallwerth Dr
- 3916 Wallwerth Dr
- 3910 Wallwerth Dr
- 3920 Wallwerth Dr
- 3859 Wallwerth Dr
- 3908 Wallwerth Dr
- 3929 Wallwerth Dr
- 3920 Jackman Rd
- 3904 Wallwerth Dr
- 3928 Wallwerth Dr
- 3857 Wallwerth Dr
- 3922 Jackman Rd
- 3924 Jackman Rd