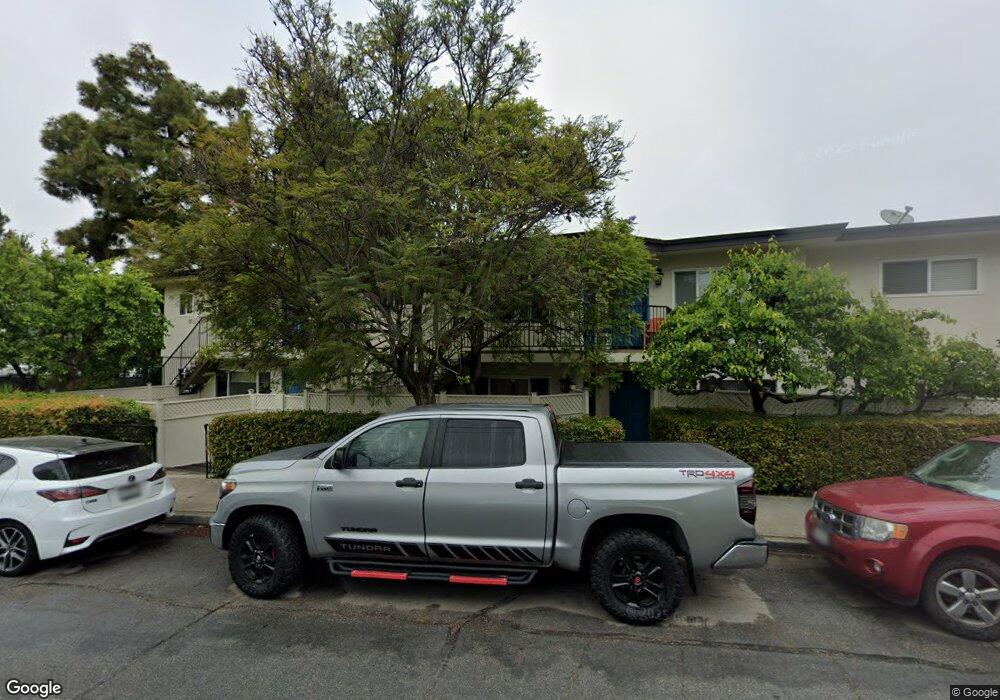
3914 Via Lucero Unit C Santa Barbara, CA 93110
Hope NeighborhoodEstimated Value: $832,000 - $959,715
2
Beds
2
Baths
1,030
Sq Ft
$875/Sq Ft
Est. Value
About This Home
This home is located at 3914 Via Lucero Unit C, Santa Barbara, CA 93110 and is currently estimated at $901,679, approximately $875 per square foot. 3914 Via Lucero Unit C is a home located in Santa Barbara County with nearby schools including Monte Vista Elementary School, La Colina Junior High School, and Santa Barbara Senior High School.
Ownership History
Date
Name
Owned For
Owner Type
Purchase Details
Closed on
Jul 12, 2017
Sold by
Karschner David L
Bought by
Bernstein Emily J
Current Estimated Value
Home Financials for this Owner
Home Financials are based on the most recent Mortgage that was taken out on this home.
Original Mortgage
$369,200
Outstanding Balance
$306,827
Interest Rate
3.9%
Mortgage Type
New Conventional
Estimated Equity
$594,852
Purchase Details
Closed on
Mar 23, 2010
Sold by
Ludwick Robert T and Ludwick Wendy E
Bought by
Karschner David L
Purchase Details
Closed on
Nov 29, 2006
Sold by
Via Lucero Partners Llc
Bought by
Ludwick Robert T and Ludwick Wendy E
Home Financials for this Owner
Home Financials are based on the most recent Mortgage that was taken out on this home.
Original Mortgage
$70,000
Interest Rate
6.32%
Mortgage Type
Credit Line Revolving
Create a Home Valuation Report for This Property
The Home Valuation Report is an in-depth analysis detailing your home's value as well as a comparison with similar homes in the area
Home Values in the Area
Average Home Value in this Area
Purchase History
| Date | Buyer | Sale Price | Title Company |
|---|---|---|---|
| Bernstein Emily J | $510,000 | Chicago Title Company | |
| Karschner David L | $330,000 | First American Title Company | |
| Ludwick Robert T | -- | First American Title Company |
Source: Public Records
Mortgage History
| Date | Status | Borrower | Loan Amount |
|---|---|---|---|
| Open | Bernstein Emily J | $369,200 | |
| Previous Owner | Ludwick Robert T | $70,000 | |
| Previous Owner | Ludwick Robert T | $560,000 |
Source: Public Records
Tax History Compared to Growth
Tax History
| Year | Tax Paid | Tax Assessment Tax Assessment Total Assessment is a certain percentage of the fair market value that is determined by local assessors to be the total taxable value of land and additions on the property. | Land | Improvement |
|---|---|---|---|---|
| 2025 | $6,129 | $580,287 | $284,454 | $295,833 |
| 2023 | $6,129 | $557,756 | $273,409 | $284,347 |
| 2022 | $5,912 | $546,821 | $268,049 | $278,772 |
| 2021 | $5,699 | $536,100 | $262,794 | $273,306 |
| 2020 | $5,638 | $530,604 | $260,100 | $270,504 |
| 2019 | $5,471 | $520,200 | $255,000 | $265,200 |
| 2018 | $5,364 | $510,000 | $250,000 | $260,000 |
| 2017 | $3,877 | $367,023 | $139,023 | $228,000 |
| 2016 | $3,816 | $359,828 | $136,298 | $223,530 |
| 2015 | $3,776 | $354,424 | $134,251 | $220,173 |
| 2014 | $3,717 | $347,483 | $131,622 | $215,861 |
Source: Public Records
Map
Nearby Homes
- 3914 Via Lucero Unit F
- 3922 Via Diego Unit A
- 3831 Sunset Rd
- 3791 State St Unit A
- 3737 San Remo Dr
- 3855 Calle Cita
- 3718 State St Unit 316
- 3718 State St Unit 314
- 3919 Via Laguna
- 3728 State St Unit 135
- 3726 State St Unit 203
- 3728 State St Unit 136
- 3726 State St Unit 204
- 3663 San Remo Dr Unit 4F
- 3706 Avon Ln
- 3676 Eileen Way
- 4004 Via Laguna
- 3708 Greggory Way
- 3708 Greggory Way Unit 1
- 4156 Vista Clara Rd
- 3914 Via Lucero Unit H
- 3914 Via Lucero Unit G
- 3914 Via Lucero Unit E
- 3914 Via Lucero Unit D
- 3914 Via Lucero Unit C
- 3914 Via Lucero Unit A
- 3913 Maricopa Dr
- 3919 Maricopa Dr
- 163 N La Cumbre Rd
- 3909 Maricopa Dr
- 3923 Maricopa Dr
- 3903 Maricopa Dr
- 3929 Maricopa Dr
- 3930 Via Lucero Unit 2
- 111 N La Cumbre Unit 20
- 111 N La Cumbre Unit 4
- 111 N La Cumbre Unit 19
- 111 N La Cumbre
- 111 N La Cumbre Unit 6
- 111 N La Cumbre