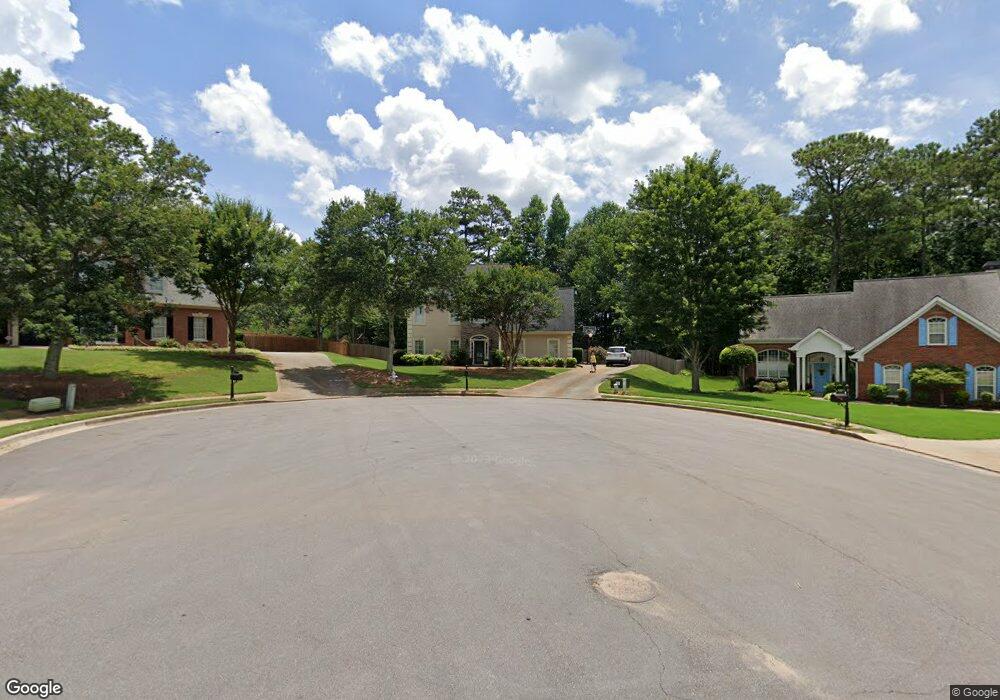
3915 Cherry Ridge Walk Unit 52 Suwanee, GA 30024
Estimated Value: $503,000 - $577,000
4
Beds
3
Baths
2,328
Sq Ft
$230/Sq Ft
Est. Value
About This Home
This home is located at 3915 Cherry Ridge Walk Unit 52, Suwanee, GA 30024 and is currently estimated at $535,069, approximately $229 per square foot. 3915 Cherry Ridge Walk Unit 52 is a home located in Gwinnett County with nearby schools including North Gwinnett Middle School, North Gwinnett High School, and Old Suwanee Christian School.
Ownership History
Date
Name
Owned For
Owner Type
Purchase Details
Closed on
Jun 5, 2015
Sold by
Ankrom Daniel L
Bought by
Friedman David Scott and Friedman Kathy Winn
Current Estimated Value
Home Financials for this Owner
Home Financials are based on the most recent Mortgage that was taken out on this home.
Original Mortgage
$183,520
Outstanding Balance
$141,993
Interest Rate
3.88%
Mortgage Type
New Conventional
Estimated Equity
$393,076
Purchase Details
Closed on
Jul 6, 2006
Sold by
Patton George E and Brooke Patton J
Bought by
Ankrom Daniel L and Thompson Alaina
Home Financials for this Owner
Home Financials are based on the most recent Mortgage that was taken out on this home.
Original Mortgage
$216,900
Interest Rate
2.5%
Mortgage Type
New Conventional
Purchase Details
Closed on
Jul 23, 1999
Sold by
Bandy Douglas T and Bandy Melina K
Bought by
Patton George E and Brooke J
Home Financials for this Owner
Home Financials are based on the most recent Mortgage that was taken out on this home.
Original Mortgage
$146,450
Interest Rate
7.66%
Mortgage Type
New Conventional
Create a Home Valuation Report for This Property
The Home Valuation Report is an in-depth analysis detailing your home's value as well as a comparison with similar homes in the area
Home Values in the Area
Average Home Value in this Area
Purchase History
| Date | Buyer | Sale Price | Title Company |
|---|---|---|---|
| Friedman David Scott | $229,400 | -- | |
| Ankrom Daniel L | $216,900 | -- | |
| Patton George E | $151,000 | -- |
Source: Public Records
Mortgage History
| Date | Status | Borrower | Loan Amount |
|---|---|---|---|
| Open | Friedman David Scott | $183,520 | |
| Previous Owner | Ankrom Daniel L | $216,900 | |
| Previous Owner | Patton George E | $146,450 |
Source: Public Records
Tax History Compared to Growth
Tax History
| Year | Tax Paid | Tax Assessment Tax Assessment Total Assessment is a certain percentage of the fair market value that is determined by local assessors to be the total taxable value of land and additions on the property. | Land | Improvement |
|---|---|---|---|---|
| 2025 | $3,959 | $162,720 | $38,000 | $124,720 |
| 2024 | $4,297 | $172,440 | $40,000 | $132,440 |
| 2023 | $4,297 | $160,280 | $40,000 | $120,280 |
| 2022 | $4,401 | $139,120 | $37,600 | $101,520 |
| 2021 | $3,418 | $101,480 | $24,920 | $76,560 |
| 2020 | $3,444 | $101,480 | $24,920 | $76,560 |
| 2019 | $2,937 | $101,480 | $24,920 | $76,560 |
| 2018 | $2,951 | $101,480 | $24,920 | $76,560 |
| 2016 | $2,631 | $86,720 | $27,600 | $59,120 |
| 2015 | $2,436 | $82,240 | $23,600 | $58,640 |
| 2014 | -- | $78,080 | $21,200 | $56,880 |
Source: Public Records
Map
Nearby Homes
- 105 Treemont Trace
- 235 Ruby Forest Pkwy
- 225 Ruby Forest Pkwy
- 4080 Cherry Ridge Walk Unit 1
- 270 Dogwood View Ct
- 4094 Dollar Cir Unit 2
- 297 Dogwood View Ln
- 366 Regal Pines Ct
- 4244 Austin Hills Dr
- 4394 Austin Hills Dr Unit 1
- 212 Suwanee Ave
- 4045 Hillcrest View Ct
- 374 Creek Manor Way
- 384 Creek Manor Way
- 3713 Lake Edge Dr
- 358 Rhodes House Ct
- 4186 Terrace Oaks Ct
- 325 Morning Mist Walk Unit 2
- 407 Vista Lake Dr
- 3915 Cherry Ridge Walk Unit 1
- 3905 Cherry Ridge Walk Unit 1
- 3964 Treemont Ln
- 3954 Treemont Ln
- 3895 Cherry Ridge Walk
- 3935 Cherry Ridge Walk
- 3974 Treemont Ln
- 3890 Cherry Ridge Walk
- 3885 Cherry Ridge Walk Unit 1
- 3945 Cherry Ridge Walk
- 3959 Treemont Ln
- 3994 Treemont Ln
- 3969 Treemont Ln Unit 2
- 3875 Cherry Ridge Walk Unit 1
- 3880 Cherry Ridge Walk Unit 1
- 3950 Cherry Ridge Walk Unit 1
- 3979 Treemont Ln
- 3955 Cherry Ridge Walk
- 4004 Treemont Ln Unit 2
- 3989 Treemont Ln Unit 2