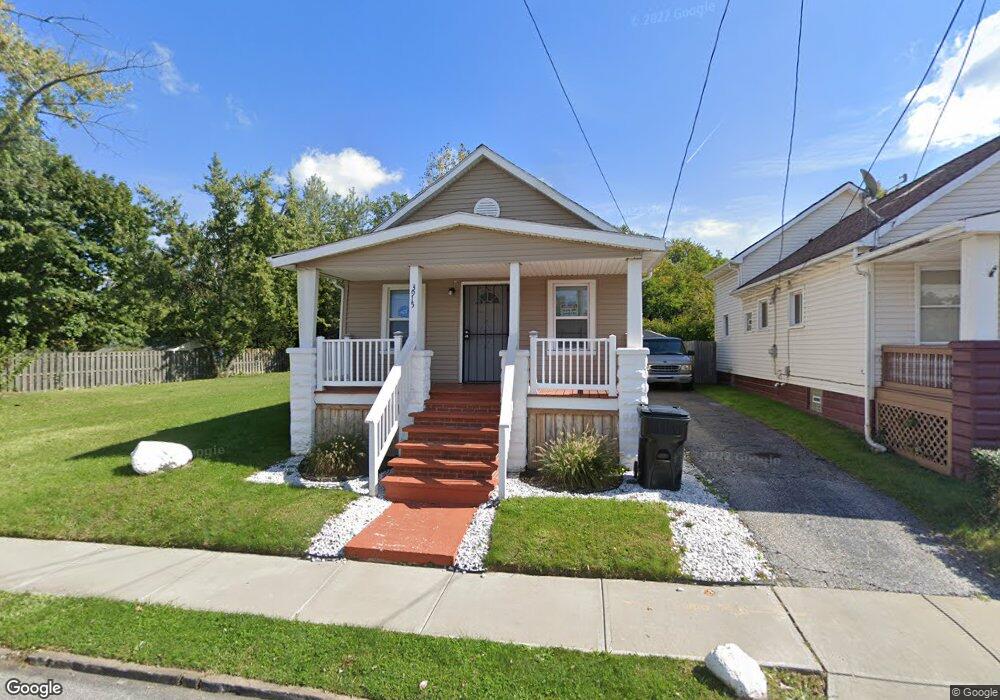
3915 E 75th St Cleveland, OH 44105
Slavic Village NeighborhoodEstimated Value: $62,000 - $75,000
3
Beds
1
Bath
880
Sq Ft
$78/Sq Ft
Est. Value
About This Home
This home is located at 3915 E 75th St, Cleveland, OH 44105 and is currently estimated at $68,457, approximately $77 per square foot. 3915 E 75th St is a home located in Cuyahoga County with nearby schools including Anton Grdina School, Bolton, and Andrew J. Rickoff School.
Ownership History
Date
Name
Owned For
Owner Type
Purchase Details
Closed on
May 1, 2013
Sold by
Steen Wade
Bought by
Adams El Rashid
Current Estimated Value
Purchase Details
Closed on
Mar 3, 2008
Sold by
Wells Fargo Bank Na
Bought by
Hopkins Hendri
Purchase Details
Closed on
Aug 28, 2007
Sold by
Heard Erline
Bought by
Wells Fargo Bank Na
Purchase Details
Closed on
Jun 14, 2006
Sold by
Lui Pak Hor and Lui Wai C
Bought by
Heard Erline
Home Financials for this Owner
Home Financials are based on the most recent Mortgage that was taken out on this home.
Original Mortgage
$72,000
Interest Rate
9.87%
Mortgage Type
Purchase Money Mortgage
Purchase Details
Closed on
Sep 6, 2005
Sold by
Bienkowski Ronald J and Bienkowski Sandra
Bought by
Lui Pak Hor
Purchase Details
Closed on
Feb 26, 2004
Sold by
Bienkowski Victoria
Bought by
Bienkowski Ronald J
Purchase Details
Closed on
Nov 11, 2002
Sold by
Der Janos and Der Eva
Bought by
Der Lajos
Purchase Details
Closed on
Jan 1, 1975
Bought by
Bienkowski Victoria
Create a Home Valuation Report for This Property
The Home Valuation Report is an in-depth analysis detailing your home's value as well as a comparison with similar homes in the area
Home Values in the Area
Average Home Value in this Area
Purchase History
| Date | Buyer | Sale Price | Title Company |
|---|---|---|---|
| Adams El Rashid | $1,600 | None Available | |
| Hopkins Hendri | $2,800 | Resource Title Agency Inc | |
| Wells Fargo Bank Na | $46,711 | Attorney | |
| Heard Erline | $80,000 | Mountaineer Title Agency | |
| Lui Pak Hor | $30,000 | Executive Title Agency | |
| Bienkowski Ronald J | -- | -- | |
| Der Lajos | $68,600 | -- | |
| Bienkowski Victoria | -- | -- |
Source: Public Records
Mortgage History
| Date | Status | Borrower | Loan Amount |
|---|---|---|---|
| Previous Owner | Heard Erline | $72,000 |
Source: Public Records
Tax History Compared to Growth
Tax History
| Year | Tax Paid | Tax Assessment Tax Assessment Total Assessment is a certain percentage of the fair market value that is determined by local assessors to be the total taxable value of land and additions on the property. | Land | Improvement |
|---|---|---|---|---|
| 2024 | $1,405 | $21,000 | $3,675 | $17,325 |
| 2023 | $624 | $8,050 | $2,590 | $5,460 |
| 2022 | $621 | $8,050 | $2,590 | $5,460 |
| 2021 | $615 | $8,050 | $2,590 | $5,460 |
| 2020 | $625 | $7,070 | $2,280 | $4,800 |
| 2019 | $579 | $20,200 | $6,500 | $13,700 |
| 2018 | $214 | $2,630 | $2,280 | $350 |
| 2017 | $1,024 | $9,210 | $1,440 | $7,770 |
| 2016 | $773 | $9,210 | $1,440 | $7,770 |
| 2015 | $776 | $9,210 | $1,440 | $7,770 |
| 2014 | $776 | $9,210 | $1,440 | $7,770 |
Source: Public Records
Map
Nearby Homes
- 7738 Spafford Rd
- 7623 Dercum Rd
- 7505 Ottawa Rd
- 7304 Worley Ave
- 3952 E 74th St
- 7509 Indiana Ave
- 7528 Ottawa Rd
- 7605 Ottawa Rd
- 3971 E 71st St
- 7427 Spafford Rd
- 6920 Hosmer Ave
- 6917 Worley Ave
- 6846 Ottawa Rd
- 4092 E 72nd St
- 6901 Fullerton Ave
- 7418 Clement Ave
- 6714 Ottawa Rd
- 6709 Gertrude Ave
- 7213 Park Ave
- 6618 Collier Ave
- 3919 E 75th St
- 3909 E 75th St
- 7513 Worley Ave
- 3923 E 75th St
- 7517 Worley Ave
- 7521 Worley Ave
- 3899 E 75th St
- 7514 Worley Ave
- 7506 Worley Ave
- 7502 Worley Ave
- 7510 Worley Ave
- 3893 E 75th St
- 7426 Worley Ave
- 7603 Worley Ave
- 7420 Worley Ave
- 7732 7736 Spafford Rd
- 7416 Worley Ave
- 3889 E 75th St
- 7605 Worley Ave
- 7605 7607 Worley Ave