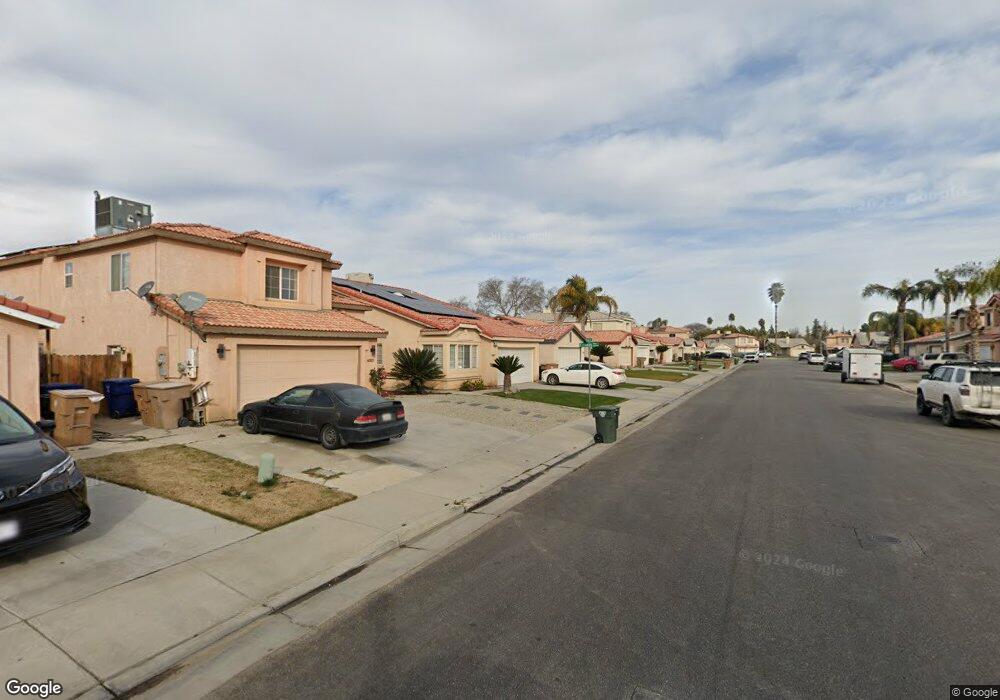
3915 Frost Way Bakersfield, CA 93311
Gosford NeighborhoodEstimated Value: $340,775 - $365,000
3
Beds
2
Baths
1,259
Sq Ft
$276/Sq Ft
Est. Value
About This Home
This home is located at 3915 Frost Way, Bakersfield, CA 93311 and is currently estimated at $347,444, approximately $275 per square foot. 3915 Frost Way is a home located in Kern County with nearby schools including Sing Lum Elementary School, Tevis Junior High School, and Stockdale High School.
Ownership History
Date
Name
Owned For
Owner Type
Purchase Details
Closed on
Apr 19, 2007
Sold by
Bowdle Clark
Bought by
Bowdle Clark and Bowdle Andrea
Current Estimated Value
Purchase Details
Closed on
Jan 22, 2003
Sold by
Clayton James and Clayton Toni
Bought by
Bowdle Clark
Home Financials for this Owner
Home Financials are based on the most recent Mortgage that was taken out on this home.
Original Mortgage
$86,100
Outstanding Balance
$33,723
Interest Rate
4.9%
Mortgage Type
Balloon
Estimated Equity
$313,721
Purchase Details
Closed on
Apr 3, 1998
Sold by
Hud
Bought by
Clayton James and Clayton Toni
Home Financials for this Owner
Home Financials are based on the most recent Mortgage that was taken out on this home.
Original Mortgage
$84,920
Interest Rate
7.07%
Mortgage Type
FHA
Purchase Details
Closed on
Jan 30, 1998
Sold by
Norwest Mtg Inc
Bought by
Hud
Purchase Details
Closed on
Jul 21, 1997
Sold by
Neal Staci R
Bought by
Norwest Mtg Inc
Purchase Details
Closed on
Feb 18, 1997
Sold by
Neal Staci R
Bought by
Norwest Mtg Company
Create a Home Valuation Report for This Property
The Home Valuation Report is an in-depth analysis detailing your home's value as well as a comparison with similar homes in the area
Home Values in the Area
Average Home Value in this Area
Purchase History
| Date | Buyer | Sale Price | Title Company |
|---|---|---|---|
| Bowdle Clark | -- | None Available | |
| Bowdle Clark | $123,000 | -- | |
| Bowdle Clark | -- | -- | |
| Clayton James | $86,000 | American Title Co | |
| Hud | -- | First American Title Ins Co | |
| Norwest Mtg Inc | $106,443 | First American Title Ins Co | |
| Norwest Mtg Company | -- | -- |
Source: Public Records
Mortgage History
| Date | Status | Borrower | Loan Amount |
|---|---|---|---|
| Open | Bowdle Clark | $86,100 | |
| Previous Owner | Clayton James | $84,920 |
Source: Public Records
Tax History Compared to Growth
Tax History
| Year | Tax Paid | Tax Assessment Tax Assessment Total Assessment is a certain percentage of the fair market value that is determined by local assessors to be the total taxable value of land and additions on the property. | Land | Improvement |
|---|---|---|---|---|
| 2025 | $2,890 | $178,121 | $43,438 | $134,683 |
| 2024 | $2,844 | $174,630 | $42,587 | $132,043 |
| 2023 | $2,844 | $171,206 | $41,752 | $129,454 |
| 2022 | $2,732 | $167,850 | $40,934 | $126,916 |
| 2021 | $2,620 | $164,560 | $40,132 | $124,428 |
| 2020 | $2,571 | $162,874 | $39,721 | $123,153 |
| 2019 | $2,539 | $162,874 | $39,721 | $123,153 |
| 2018 | $2,433 | $156,552 | $38,180 | $118,372 |
| 2017 | $2,399 | $153,483 | $37,432 | $116,051 |
| 2016 | $2,256 | $150,475 | $36,699 | $113,776 |
| 2015 | $2,236 | $148,215 | $36,148 | $112,067 |
| 2014 | $2,183 | $145,312 | $35,440 | $109,872 |
Source: Public Records
Map
Nearby Homes
- 9609 Salinger St
- 9408 Nickam Ct
- 9704 Gold Dust Dr
- 3812 Millay Way
- 9711 Touchstone Dr
- 9209 Campus Park Ct
- 9902 Rancho Verde Dr
- 4000 Clancy Ct
- 9813 Fitzgerald Dr
- 9608 Lacroix Ct
- 9400 Hemingway Place
- 9008 Heely Ct
- 10213 Single Oak Dr
- 10214 Pepperwood Dr
- 10126 Pyramid Peak Dr Unit 5
- 4300 Keyes Ct
- 10204 Sunset Canyon Dr
- 3912 Cornerstone Way
- 3105 Whisper Oak Way
- 4400 Cron Way
- 3911 Frost Way
- 3919 Frost Way
- 3923 Frost Way
- 3907 Frost Way
- 4001 Frost Way
- 3903 Frost Way
- 3914 Frost Way
- 3910 Frost Way
- 3918 Frost Way
- 4005 Frost Way
- 3817 Frost Way
- 3906 Frost Way
- 3902 Frost Way
- 4009 Frost Way
- 3813 Frost Way
- 3816 Frost Way
- 9518 Clemens Way
- 3809 Frost Way
- 4013 Frost Way
- 9615 Clemens Way