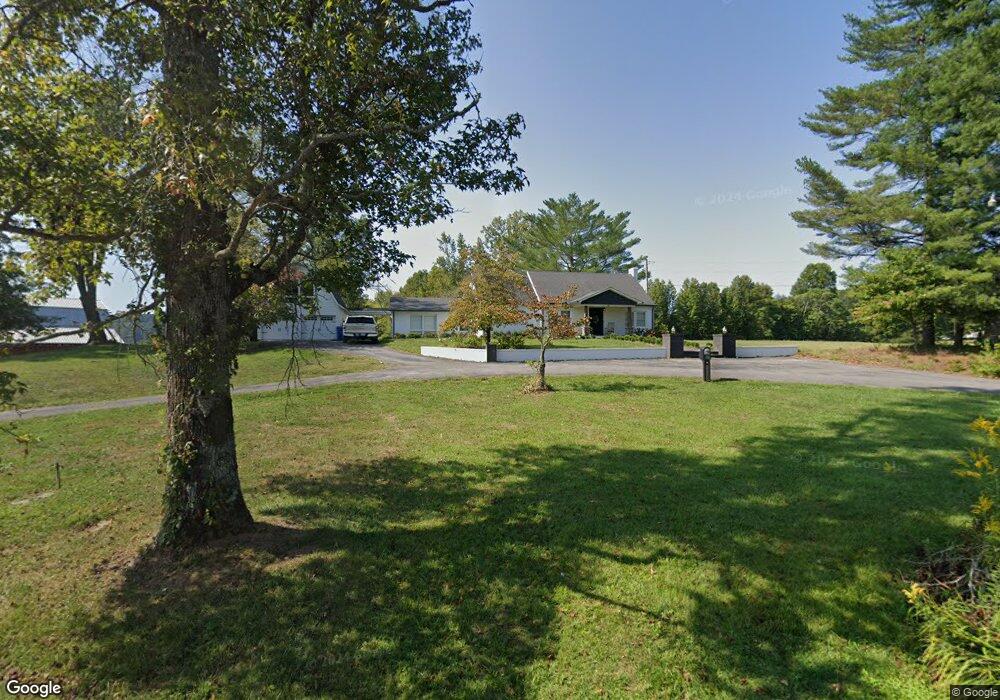
3915 Phifer Mountain Rd Cookeville, TN 38506
Estimated Value: $359,000 - $445,000
--
Bed
1
Bath
1,512
Sq Ft
$266/Sq Ft
Est. Value
About This Home
This home is located at 3915 Phifer Mountain Rd, Cookeville, TN 38506 and is currently estimated at $402,000, approximately $265 per square foot. 3915 Phifer Mountain Rd is a home located in Putnam County with nearby schools including Prescott South Elementary School, Cookeville High School, and Prescott South Middle School.
Ownership History
Date
Name
Owned For
Owner Type
Purchase Details
Closed on
Dec 14, 2023
Sold by
Talbott Anna Sue
Bought by
Talbott Anna Sue and Turner Leah
Current Estimated Value
Purchase Details
Closed on
Oct 5, 2023
Sold by
Alami Hamid and Alami Fatima
Bought by
Rice Chadrick L
Purchase Details
Closed on
Nov 29, 2022
Sold by
Mckinney Jason Scott and Mckinney Christa D
Bought by
Alami Hamid and Sighalem Fatima
Purchase Details
Closed on
Nov 21, 2022
Sold by
Mckinney Jason Scott and Mckinney Christa D
Bought by
Rice Chadrick L
Purchase Details
Closed on
Nov 10, 2022
Sold by
Mckinney Jason Scott and Mckinney Christa D
Bought by
Twin Lakes Communications Inc
Create a Home Valuation Report for This Property
The Home Valuation Report is an in-depth analysis detailing your home's value as well as a comparison with similar homes in the area
Home Values in the Area
Average Home Value in this Area
Purchase History
| Date | Buyer | Sale Price | Title Company |
|---|---|---|---|
| Talbott Anna Sue | -- | None Listed On Document | |
| Talbott Anna Sue | -- | None Listed On Document | |
| Rice Chadrick L | $165,550 | Concord Title | |
| Alami Hamid | $124,000 | -- | |
| Alami Hamid | $124,000 | None Listed On Document | |
| Talbott Anna Sue | $195,501 | -- | |
| Talbott Anna Sue | $195,501 | None Listed On Document | |
| Rich Froning Properties Llc | $275,002 | -- | |
| Rich Froning Properties Llc | $275,002 | None Listed On Document | |
| Rice Chadrick L | $294,100 | -- | |
| Rice Chadrick L | $294,100 | None Listed On Document | |
| Twin Lakes Communications Inc | $30,000 | -- |
Source: Public Records
Tax History Compared to Growth
Tax History
| Year | Tax Paid | Tax Assessment Tax Assessment Total Assessment is a certain percentage of the fair market value that is determined by local assessors to be the total taxable value of land and additions on the property. | Land | Improvement |
|---|---|---|---|---|
| 2024 | $904 | $34,000 | $11,900 | $22,100 |
| 2023 | $904 | $34,000 | $11,900 | $22,100 |
| 2022 | $1,704 | $68,800 | $33,825 | $34,975 |
| 2021 | $1,701 | $68,800 | $33,825 | $34,975 |
| 2020 | $1,565 | $68,800 | $33,825 | $34,975 |
| 2019 | $1,565 | $53,500 | $31,500 | $22,000 |
| 2018 | $1,100 | $40,300 | $31,500 | $8,800 |
| 2017 | $1,100 | $40,300 | $31,500 | $8,800 |
| 2016 | $1,100 | $40,300 | $31,500 | $8,800 |
| 2015 | $1,130 | $40,300 | $31,500 | $8,800 |
| 2014 | $843 | $30,060 | $0 | $0 |
Source: Public Records
Map
Nearby Homes
- 4850 Highway 70 E
- 2396 Highway 70 E
- 1940 Karen Cir
- 2857 Seven Springs Rd
- 3604 Bartlett Dr
- 1561 Edgefield Ct
- 2375 Hidden Cove Rd
- 000 Lake Valley Dr
- 00 Lake Valley Dr
- 2233 Hitchcock Dr
- 1756 Kirby Ln
- 5526 Mount Herman Rd
- 3382 Dietz Dr
- 3374 Stafford Dr
- 0 Boyd Farris Rd
- 3766 Old Bridge Rd
- 1757 Bob Bullock Rd
- 1720 Lee Hollow Rd
- 3915 Phifer Mountain Rd
- 00 Phifer Mountain Rd
- 3900 Clouse Dr
- 3860 Phifer Mountain Rd
- 4088 Clouse Dr
- 4410 Cherry Creek Rd
- 0 Phifer Mountain Rd Unit RTC2525004
- 5950 Phifer Mountain Rd
- 11 Acres Phifer Mountain Rd
- 30 Acres Phifer Mountain Rd
- 45 Acres Phifer Mountain Rd
- 6.13 AC Phifer Mountain Rd
- TRAC 3 Phifer Mountain Rd
- TRAC 4 Phifer Mountain Rd
- 6.13ac Phifer Mountain Rd
- 0 Phifer Mountain Rd
- 4382 Cherry Creek Rd
- 4494 Cherry Creek Rd
- 4500 Cherry Creek Rd
- 3404 Highway 70 E