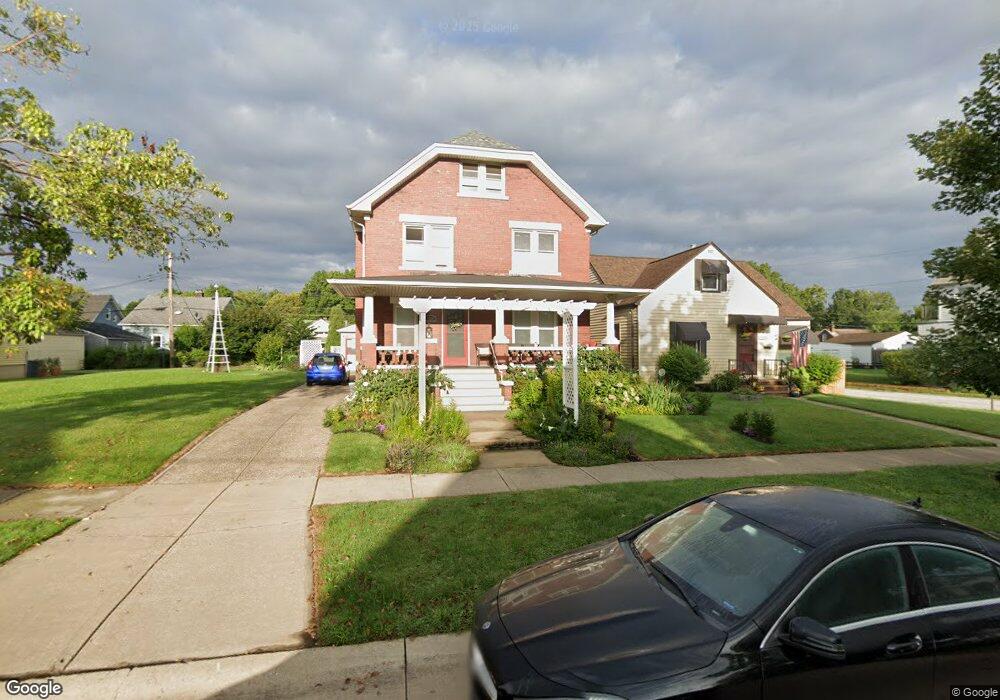
3916 E 42nd St Newburgh Heights, OH 44105
Estimated Value: $101,078
4
Beds
2
Baths
2,179
Sq Ft
$46/Sq Ft
Est. Value
About This Home
This home is located at 3916 E 42nd St, Newburgh Heights, OH 44105 and is currently priced at $101,078, approximately $46 per square foot. 3916 E 42nd St is a home located in Cuyahoga County with nearby schools including Washington Park Community, Cleveland College Preparatory School, and St Stanislaus School.
Ownership History
Date
Name
Owned For
Owner Type
Purchase Details
Closed on
Jun 27, 2010
Sold by
Fannie Mae
Bought by
Marold Gregory A
Current Estimated Value
Purchase Details
Closed on
Jan 11, 2010
Sold by
Piskae Neil A
Bought by
Federal National Mortgage Association
Purchase Details
Closed on
Mar 24, 1998
Sold by
Avsec Thomas J and Avsec Theresa M
Bought by
Piskac Neil A
Home Financials for this Owner
Home Financials are based on the most recent Mortgage that was taken out on this home.
Original Mortgage
$71,250
Interest Rate
7.15%
Purchase Details
Closed on
Nov 3, 1987
Sold by
Matusik Genevieve
Bought by
Avsec Thomas J
Purchase Details
Closed on
Jul 7, 1986
Sold by
Matusik Chester and Matusik Genevieve
Bought by
Matusik Genevieve
Purchase Details
Closed on
Apr 1, 1985
Sold by
Matusik Genevieve and Matusik Chester
Bought by
Matusik Chester and Matusik Genevieve
Purchase Details
Closed on
Jan 1, 1975
Bought by
Matusik Genevieve and Matusik Chester
Create a Home Valuation Report for This Property
The Home Valuation Report is an in-depth analysis detailing your home's value as well as a comparison with similar homes in the area
Home Values in the Area
Average Home Value in this Area
Purchase History
| Date | Buyer | Sale Price | Title Company |
|---|---|---|---|
| Marold Gregory A | $23,000 | Allodial | |
| Federal National Mortgage Association | $60,108 | None Available | |
| Piskac Neil A | $75,000 | -- | |
| Avsec Thomas J | $48,000 | -- | |
| Matusik Genevieve | -- | -- | |
| Matusik Chester | -- | -- | |
| Matusik Genevieve | -- | -- |
Source: Public Records
Mortgage History
| Date | Status | Borrower | Loan Amount |
|---|---|---|---|
| Previous Owner | Piskac Neil A | $71,250 |
Source: Public Records
Tax History
| Year | Tax Paid | Tax Assessment Tax Assessment Total Assessment is a certain percentage of the fair market value that is determined by local assessors to be the total taxable value of land and additions on the property. | Land | Improvement |
|---|---|---|---|---|
| 2024 | -- | -- | -- | -- |
| 2022 | $248 | $21,140 | $3,570 | $17,570 |
| 2021 | $2,161 | $21,140 | $3,570 | $17,570 |
| 2020 | $2,304 | $19,740 | $3,330 | $16,420 |
| 2019 | $2,175 | $56,400 | $9,500 | $46,900 |
| 2018 | $2,170 | $19,740 | $3,330 | $16,420 |
| 2017 | $2,386 | $21,320 | $3,220 | $18,100 |
| 2016 | $2,372 | $21,320 | $3,220 | $18,100 |
| 2015 | $2,535 | $21,320 | $3,220 | $18,100 |
| 2014 | $2,535 | $23,170 | $3,500 | $19,670 |
Source: Public Records
Map
Nearby Homes
- 3628 Beyerle Rd
- 3646 Independence Rd
- 3716 E 50th St
- 5295 Harvard Ave
- 3690 E 50th St
- 3609 E 46th St
- 3704 E 52nd St
- 5412 Orey Ave
- 4001 E 54th St
- 4017 E 54th St
- 3799 E 54th St
- 3558 E 46th St
- 3880 E 57th St
- 3660 E 53rd St
- 3654 E 53rd St
- 4099 E 56th St
- 3663 E 54th St
- 3641 E 54th St
- 4101 E 57th St
- 5806 Fleet Ave
Your Personal Tour Guide
Ask me questions while you tour the home.