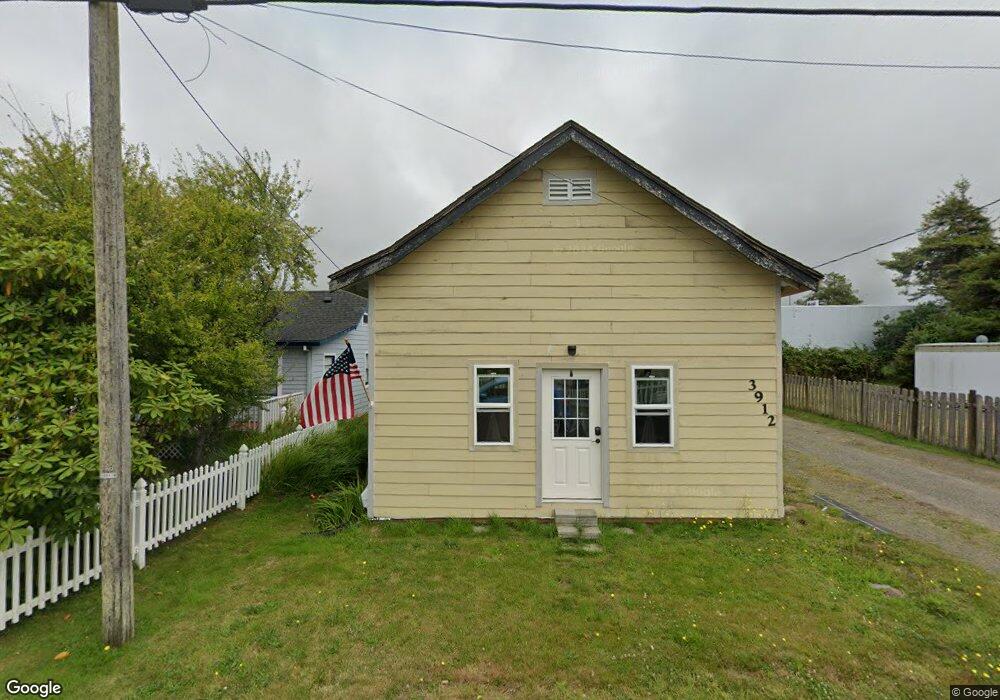
3916 L Place Seaview, WA 98644
Estimated Value: $229,000 - $347,000
4
Beds
2
Baths
1,968
Sq Ft
$150/Sq Ft
Est. Value
About This Home
This home is located at 3916 L Place, Seaview, WA 98644 and is currently estimated at $294,436, approximately $149 per square foot. 3916 L Place is a home located in Pacific County with nearby schools including Ilwaco Senior High School and The Sea School Cooperative.
Ownership History
Date
Name
Owned For
Owner Type
Purchase Details
Closed on
Aug 28, 2024
Sold by
Carner Christi
Bought by
Carner Craig Anthony and Carner Linda
Current Estimated Value
Home Financials for this Owner
Home Financials are based on the most recent Mortgage that was taken out on this home.
Original Mortgage
$230,000
Outstanding Balance
$227,563
Interest Rate
6.78%
Mortgage Type
New Conventional
Estimated Equity
$66,873
Purchase Details
Closed on
Jul 18, 2022
Sold by
Stanley Cody D and Stanley Pamela N
Bought by
Green Linda and Carner Craig A
Home Financials for this Owner
Home Financials are based on the most recent Mortgage that was taken out on this home.
Original Mortgage
$173,250
Interest Rate
5.78%
Mortgage Type
New Conventional
Purchase Details
Closed on
Nov 20, 2014
Sold by
Stanley Eleanor
Bought by
Stanley Cody D and Stanley Pamela N
Purchase Details
Closed on
Jun 10, 2013
Sold by
Maxson Kathleen M
Bought by
Stanley Eleanor
Create a Home Valuation Report for This Property
The Home Valuation Report is an in-depth analysis detailing your home's value as well as a comparison with similar homes in the area
Home Values in the Area
Average Home Value in this Area
Purchase History
| Date | Buyer | Sale Price | Title Company |
|---|---|---|---|
| Carner Craig Anthony | $769 | Horizon Title Group | |
| Green Linda | $192,500 | Emerald Coast Title | |
| Stanley Cody D | -- | None Available | |
| Stanley Eleanor | -- | Accommodation |
Source: Public Records
Mortgage History
| Date | Status | Borrower | Loan Amount |
|---|---|---|---|
| Open | Carner Craig Anthony | $230,000 | |
| Previous Owner | Green Linda | $173,250 |
Source: Public Records
Tax History Compared to Growth
Tax History
| Year | Tax Paid | Tax Assessment Tax Assessment Total Assessment is a certain percentage of the fair market value that is determined by local assessors to be the total taxable value of land and additions on the property. | Land | Improvement |
|---|---|---|---|---|
| 2025 | $1,848 | $273,000 | $115,000 | $158,000 |
| 2024 | $1,848 | $266,200 | $112,100 | $154,100 |
| 2023 | $1,765 | $232,100 | $97,800 | $134,300 |
| 2022 | $1,859 | $177,500 | $74,800 | $102,700 |
| 2021 | $1,790 | $157,000 | $66,100 | $90,900 |
| 2020 | $1,701 | $136,500 | $57,500 | $79,000 |
| 2019 | $1,771 | $136,600 | $65,000 | $71,600 |
| 2018 | $1,950 | $131,300 | $65,000 | $66,300 |
| 2017 | $1,847 | $131,300 | $65,000 | $66,300 |
| 2015 | $1,675 | $120,700 | $65,000 | $55,700 |
| 2014 | -- | $118,000 | $65,000 | $53,000 |
| 2012 | -- | $142,200 | $65,000 | $77,200 |
Source: Public Records
Map
Nearby Homes
- 4109 K Place
- 4202 L Place
- 1103 37th Place
- 4311 K Place
- 1204 37th Place
- 3504 L Place
- 0 35th & J Ln Unit NWM2441711
- 0 40th St
- 2990 40th St
- 1420 48th St Unit 8
- 1410 48th St Unit A15
- 1420 48th St Unit B-10
- 1115 31st St
- 4814 N Place
- 1205 49th St
- 6001 Fourth St
- 5001 Fourth St
- 4001 Fourth St
- 0 Fourth St Unit NWM2418945
- 1214 50 St