
3916 Lincoln Livingston, CA 95334
Estimated payment $7,201/month
About This Lot
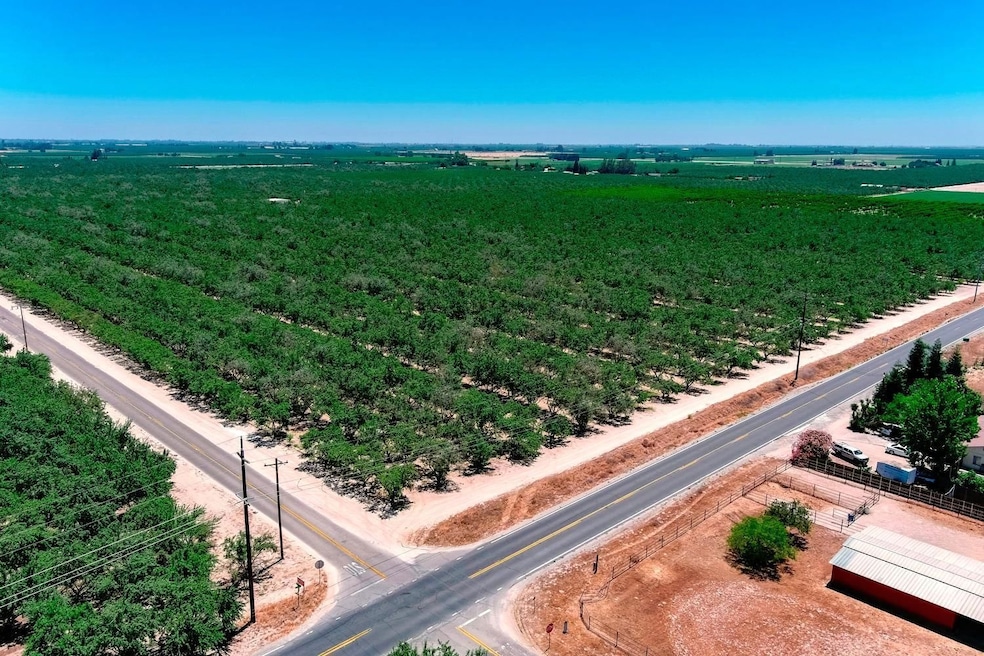
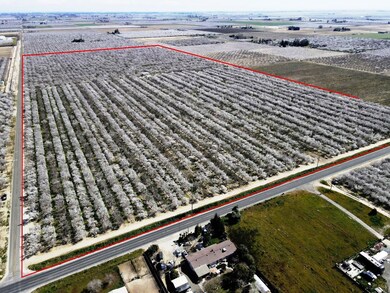
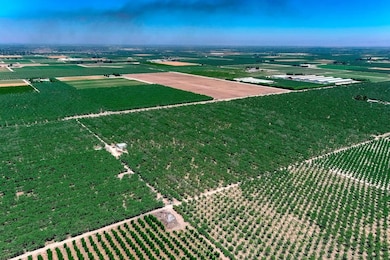
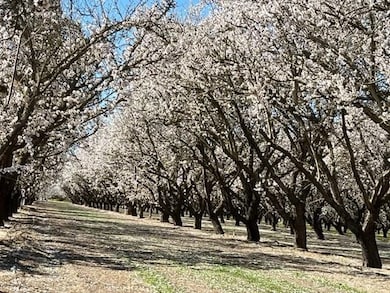
Almond Ranch of approx. 38.5ac. The property is located at the SW corner of Lincoln & Bell which is approx. 1.75 miles south of the Livingston City Limits. This meticulously maintained ranch shows great pride of ownership backed by its strong production history and two water sources make this a must see. Varieties include NP/Monterey/Carmel. Spacing is at 22'x16'. The property also benefits from (3) delivery water systems; a dual line drip system which can be supplied by either the 50hp ag well or the surface water via the 30hp booster & irrigates the ranch in one set, 2nd is the solid set impact sprinklers system which can be supplied by the 50 hp ag well or the surface water via the 50hp booster. There is a three tank sand media filter station to filter either water source complimented by the trash screen, the ranch is also flood capable.

Property Details
Property Type
- Land
Est. Annual Taxes
- $7,085
Lot Details
- Current uses include agriculture, orchard/vineyards, agribusiness
- Potential uses include agriculture
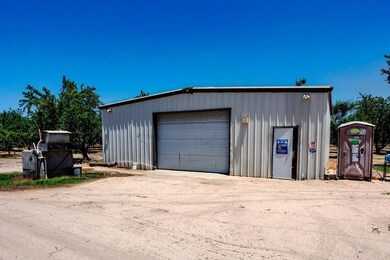
Outdoor Features
- Shop
Map
Home Values in the Area
Average Home Value in this Area
Tax History
| Year | Tax Paid | Tax Assessment Tax Assessment Total Assessment is a certain percentage of the fair market value that is determined by local assessors to be the total taxable value of land and additions on the property. | Land | Improvement |
|---|---|---|---|---|
| 2025 | $7,085 | $614,071 | $507,532 | $106,539 |
| 2024 | $7,085 | $547,295 | $442,845 | $104,450 |
| 2023 | $7,004 | $544,303 | $441,901 | $102,402 |
| 2022 | $6,818 | $523,971 | $423,576 | $100,395 |
| 2021 | $6,861 | $525,362 | $423,557 | $101,805 |
| 2020 | $6,780 | $519,243 | $400,207 | $119,036 |
| 2019 | $6,473 | $511,083 | $379,723 | $131,360 |
| 2018 | $5,393 | $404,436 | $216,113 | $188,323 |
| 2017 | $5,955 | $460,262 | $216,113 | $244,149 |
| 2016 | $4,840 | $447,107 | $166,072 | $281,035 |
| 2015 | $4,730 | $436,040 | $163,578 | $272,462 |
| 2014 | $4,389 | $404,833 | $160,375 | $244,458 |
Property History
| Date | Event | Price | Change | Sq Ft Price |
|---|---|---|---|---|
| 02/19/2025 02/19/25 | Price Changed | $1,193,500 | -8.8% | -- |
| 01/12/2024 01/12/24 | Price Changed | $1,309,000 | -6.8% | -- |
| 12/13/2023 12/13/23 | For Sale | $1,405,250 | +17.7% | -- |
| 07/05/2022 07/05/22 | For Sale | $1,193,500 | -- | -- |
Purchase History
| Date | Type | Sale Price | Title Company |
|---|---|---|---|
| Interfamily Deed Transfer | -- | None Available | |
| Grant Deed | $1,421,000 | Chicago Title Company | |
| Interfamily Deed Transfer | -- | -- |
Mortgage History
| Date | Status | Loan Amount | Loan Type |
|---|---|---|---|
| Previous Owner | $255,000 | Unknown | |
| Closed | $0 | Commercial |
- 12737 Westside Blvd
- 5051 Lincoln Blvd
- 2617 Lincoln Blvd
- 4270 Sultana Ave
- 0 Sunset Ave Unit 225056587
- 0 Davis St Unit MC25072753
- 0 0 Davis St Unit 225040844
- 13638 Peach Ave
- 14926 Peach Ave
- 4024 Washington Blvd
- 2146 Virginia Ave
- 1557 Monte Cristo Way
- 1470 Queen Way Unit 17
- 1446 Pinot Dr
- 1400 Queen Way Unit 22
- 14923 Westside Blvd
- 1330 Queen Way Unit 27
- 825 Knights Ct
- 4714 Arena Way
- 15238 Sunset Dr
- 1230 Davis St
- 1164-1576 Olive Ave
- 1850 Grove Ave Unit 5
- 1670 Bellevue Rd Unit 2
- 1670 Bellevue Rd Unit 1
- 3101 Chestnut Dr
- 252 Branco Ave
- 2300 Cascade Dr
- 2745 Muir Ave Unit 2745
- 5261 Elliott Ave
- 431 Tandoori Way
- 2908 Willowbrook Ct
- 1756 Willowbrook Dr
- 1380 Eagle Rdg Dr
- 3640 Newport Ave
- 875 N Johnson Rd
- 4188 Adobe Ct
- 1205 Devonwood Dr
- 312 W Main St
- 312 W Main St