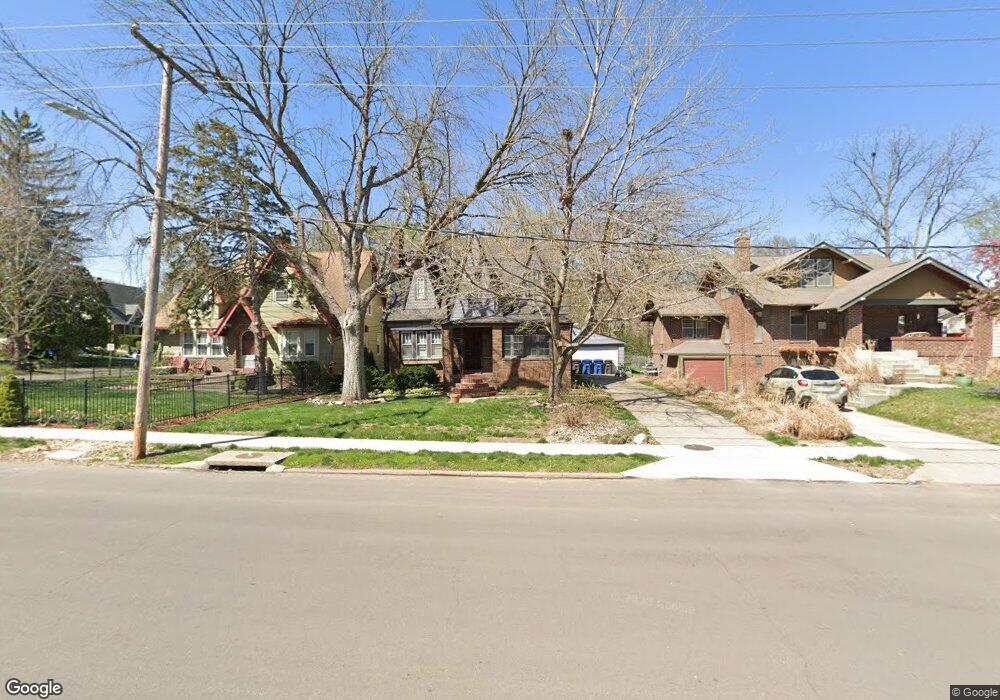
3917 Franklin Ave Des Moines, IA 50310
Beaverdale NeighborhoodEstimated Value: $260,000 - $287,000
3
Beds
2
Baths
1,528
Sq Ft
$179/Sq Ft
Est. Value
About This Home
This home is located at 3917 Franklin Ave, Des Moines, IA 50310 and is currently estimated at $272,868, approximately $178 per square foot. 3917 Franklin Ave is a home located in Polk County with nearby schools including Perkins Elementary School, Merrill Middle School, and Roosevelt High School.
Ownership History
Date
Name
Owned For
Owner Type
Purchase Details
Closed on
Jun 28, 2004
Sold by
Penfield Mitch L and Penfield Stacy L
Bought by
Isaacson Lexi J
Current Estimated Value
Home Financials for this Owner
Home Financials are based on the most recent Mortgage that was taken out on this home.
Original Mortgage
$110,000
Interest Rate
6.37%
Mortgage Type
Purchase Money Mortgage
Purchase Details
Closed on
Jun 22, 2000
Sold by
Ricon Llc
Bought by
Penfield Mitch L and Penfield Stacy L
Home Financials for this Owner
Home Financials are based on the most recent Mortgage that was taken out on this home.
Original Mortgage
$105,300
Interest Rate
8.56%
Purchase Details
Closed on
Nov 17, 1998
Sold by
Isaacson Richard W and Isaacson David J
Bought by
Ricon L L C
Create a Home Valuation Report for This Property
The Home Valuation Report is an in-depth analysis detailing your home's value as well as a comparison with similar homes in the area
Home Values in the Area
Average Home Value in this Area
Purchase History
| Date | Buyer | Sale Price | Title Company |
|---|---|---|---|
| Isaacson Lexi J | $136,500 | -- | |
| Penfield Mitch L | $116,500 | -- | |
| Ricon L L C | $41,000 | -- |
Source: Public Records
Mortgage History
| Date | Status | Borrower | Loan Amount |
|---|---|---|---|
| Closed | Isaacson Lexi J | $110,000 | |
| Previous Owner | Penfield Mitch L | $105,300 |
Source: Public Records
Tax History
| Year | Tax Paid | Tax Assessment Tax Assessment Total Assessment is a certain percentage of the fair market value that is determined by local assessors to be the total taxable value of land and additions on the property. | Land | Improvement |
|---|---|---|---|---|
| 2025 | $4,154 | $244,600 | $38,300 | $206,300 |
| 2024 | $4,154 | $221,600 | $34,400 | $187,200 |
| 2023 | $4,202 | $221,600 | $34,400 | $187,200 |
| 2022 | $4,168 | $187,200 | $30,400 | $156,800 |
| 2021 | $4,022 | $187,200 | $30,400 | $156,800 |
| 2020 | $4,174 | $169,800 | $27,800 | $142,000 |
| 2019 | $3,896 | $169,800 | $27,800 | $142,000 |
| 2018 | $3,852 | $153,500 | $24,800 | $128,700 |
| 2017 | $3,692 | $153,500 | $24,800 | $128,700 |
| 2016 | $3,592 | $145,000 | $21,700 | $123,300 |
| 2015 | $3,592 | $145,000 | $21,700 | $123,300 |
| 2014 | $3,392 | $136,400 | $19,600 | $116,800 |
Source: Public Records
Map
Nearby Homes
Your Personal Tour Guide
Ask me questions while you tour the home.