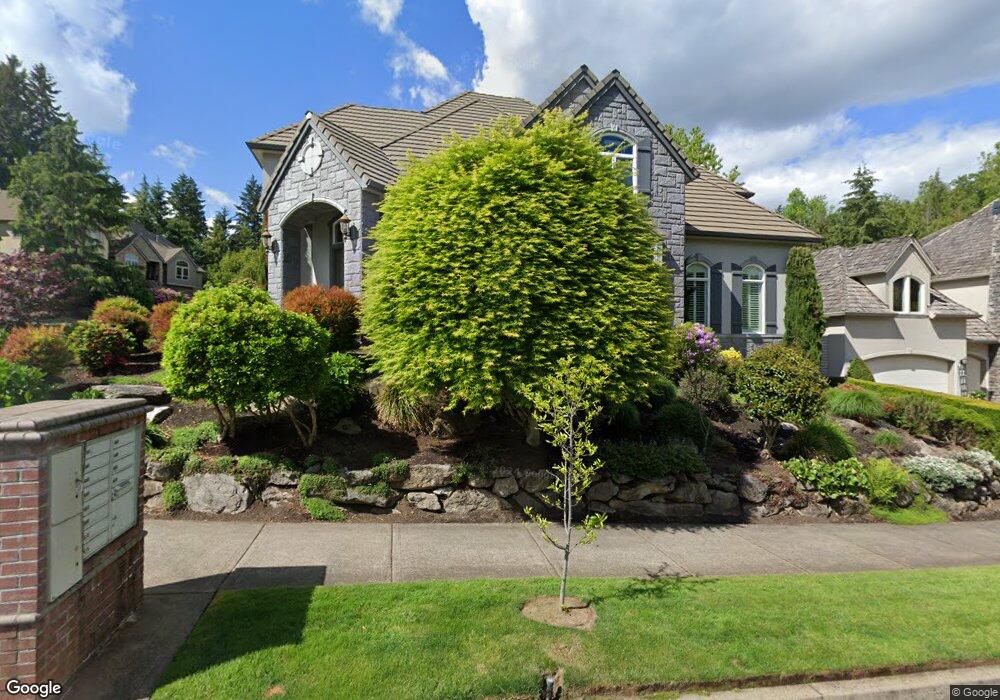
3918 N Hampton Ct West Linn, OR 97068
Barrington Heights NeighborhoodEstimated Value: $1,195,000 - $1,498,000
4
Beds
4
Baths
4,102
Sq Ft
$326/Sq Ft
Est. Value
About This Home
This home is located at 3918 N Hampton Ct, West Linn, OR 97068 and is currently estimated at $1,338,726, approximately $326 per square foot. 3918 N Hampton Ct is a home located in Clackamas County with nearby schools including Sunset Primary School, Rosemont Ridge Middle School, and West Linn High School.
Ownership History
Date
Name
Owned For
Owner Type
Purchase Details
Closed on
Apr 5, 2019
Sold by
Beyer Stephen M and Hwa Leslie C
Bought by
Stephen Beyer And Leslie Hwa Rev Tr
Current Estimated Value
Purchase Details
Closed on
Jun 21, 2017
Sold by
Stuart Robert A
Bought by
Hwa Leslie C and Beyer Stephen M
Purchase Details
Closed on
Apr 25, 2016
Sold by
Stuart Robert Andre
Bought by
Stuart Robert A and Robert A Stuart Trust
Purchase Details
Closed on
Jun 18, 2008
Sold by
Stuart Stacey Daniels
Bought by
Stuart Robert Andre
Purchase Details
Closed on
Nov 18, 2003
Sold by
Hymark Custom Homes Inc
Bought by
Stuart Robert A and Stuart Stacey D
Home Financials for this Owner
Home Financials are based on the most recent Mortgage that was taken out on this home.
Original Mortgage
$593,600
Interest Rate
3.75%
Mortgage Type
Purchase Money Mortgage
Create a Home Valuation Report for This Property
The Home Valuation Report is an in-depth analysis detailing your home's value as well as a comparison with similar homes in the area
Home Values in the Area
Average Home Value in this Area
Purchase History
| Date | Buyer | Sale Price | Title Company |
|---|---|---|---|
| Stephen Beyer And Leslie Hwa Rev Tr | -- | None Available | |
| Beyer Stephen M | -- | None Available | |
| Hwa Leslie C | $860,000 | Fidelity Natl Title Co Of Or | |
| Stuart Robert A | -- | None Available | |
| Stuart Robert Andre | -- | None Available | |
| Stuart Robert A | $742,000 | Fidelity Natl Title Co Of Or |
Source: Public Records
Mortgage History
| Date | Status | Borrower | Loan Amount |
|---|---|---|---|
| Previous Owner | Stuart Robert A | $593,600 |
Source: Public Records
Tax History Compared to Growth
Tax History
| Year | Tax Paid | Tax Assessment Tax Assessment Total Assessment is a certain percentage of the fair market value that is determined by local assessors to be the total taxable value of land and additions on the property. | Land | Improvement |
|---|---|---|---|---|
| 2025 | $20,418 | $1,094,045 | -- | -- |
| 2024 | $19,719 | $1,062,180 | -- | -- |
| 2023 | $19,719 | $1,031,243 | $0 | $0 |
| 2022 | $18,507 | $1,001,207 | $0 | $0 |
| 2021 | $16,695 | $972,046 | $0 | $0 |
| 2020 | $16,651 | $943,734 | $0 | $0 |
| 2019 | $15,836 | $916,247 | $0 | $0 |
| 2018 | $15,165 | $889,560 | $0 | $0 |
| 2017 | $14,693 | $863,650 | $0 | $0 |
| 2016 | $14,264 | $838,495 | $0 | $0 |
| 2015 | $13,785 | $814,073 | $0 | $0 |
| 2014 | $13,079 | $790,362 | $0 | $0 |
Source: Public Records
Map
Nearby Homes
- 3648 Fairhaven Dr
- 3663 Landis St
- 2650 Lorinda Ln
- 2625 Beacon Hill Dr
- 3776 Landis St
- 3808 Fairhaven Dr
- 4110 Cornwall St
- 4194 Cornwall St
- 4190 Cornwall St
- 4192 Cornwall St
- 4147 Cornwall St
- 4123 Cornwall St Unit Lot 2
- 3900 Edgewood Ct
- 4253 Sussex St
- 4425 Cornwall St Unit 7
- 3500 Riverknoll Way
- 2525 Sunset Ave
- 3041 Winkel Way
- 3296 Nomie Way
- 2325 Sunset Ave
- 3918 Northhampton Ct
- 3691 Fairhaven Dr
- 3920 Northhampton Ct
- 3675 Fairhaven Dr
- 3919 N Hampton Ct
- 3932 Northhampton Ct
- 3919 Northhampton Ct
- 3921 Northhampton Ct
- 3672 Fairhaven Dr
- 3667 Fairhaven Dr
- 3944 Northhampton Ct
- 3933 Northhampton Ct
- 3705 Fairhaven Dr
- 3957 Northhampton Ct
- 3715 Fairhaven Dr
- 3883 Southhampton Ct
- 2155 Fairhaven Ct
- 3664 Fairhaven Dr
- 3659 Fairhaven Dr
- 2730 Beacon Hill Dr