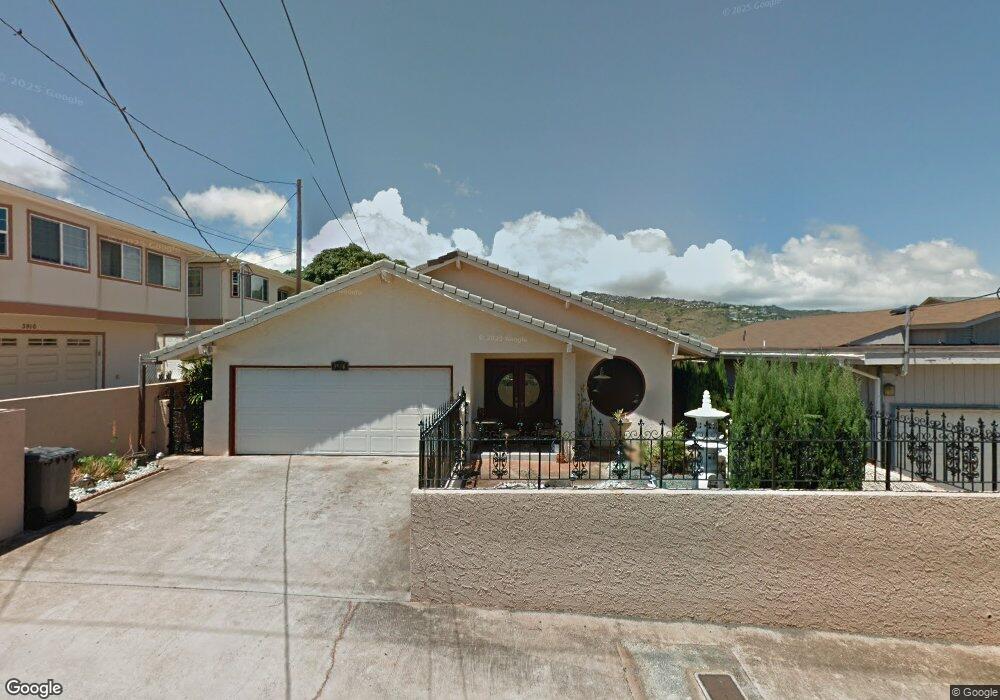
3918 Pahoa Ave Honolulu, HI 96816
Kaimuki NeighborhoodEstimated Value: $1,395,000 - $1,812,000
3
Beds
2
Baths
1,830
Sq Ft
$841/Sq Ft
Est. Value
About This Home
This home is located at 3918 Pahoa Ave, Honolulu, HI 96816 and is currently estimated at $1,538,127, approximately $840 per square foot. 3918 Pahoa Ave is a home located in Honolulu County with nearby schools including Kaimuki Middle School, Kalani High School, and Wai'alae Elementary Public Charter School.
Ownership History
Date
Name
Owned For
Owner Type
Purchase Details
Closed on
May 28, 2014
Sold by
Dang Danny H
Bought by
Dang Danny H and Dang Laura
Current Estimated Value
Home Financials for this Owner
Home Financials are based on the most recent Mortgage that was taken out on this home.
Original Mortgage
$535,000
Outstanding Balance
$361,039
Interest Rate
4.27%
Mortgage Type
New Conventional
Estimated Equity
$1,177,088
Purchase Details
Closed on
Oct 8, 2013
Sold by
Dang Danny Huyduc and Dang Laura
Bought by
Dang Danny H
Purchase Details
Closed on
Aug 25, 2005
Sold by
Shitabata Paul K
Bought by
Dang Danny Huyduc and Dang Laura
Home Financials for this Owner
Home Financials are based on the most recent Mortgage that was taken out on this home.
Original Mortgage
$660,000
Interest Rate
5.61%
Mortgage Type
New Conventional
Purchase Details
Closed on
May 6, 2005
Sold by
Shitabata Paul K
Bought by
Shitabata Md Paul K and Shitabata Evangeline Uy
Purchase Details
Closed on
Dec 29, 2004
Sold by
Tanimoto June Y
Bought by
Shitabata Paul K
Create a Home Valuation Report for This Property
The Home Valuation Report is an in-depth analysis detailing your home's value as well as a comparison with similar homes in the area
Home Values in the Area
Average Home Value in this Area
Purchase History
| Date | Buyer | Sale Price | Title Company |
|---|---|---|---|
| Dang Danny H | -- | Fidelity National Title & Es | |
| Dang Danny H | -- | Fidelity National Title & Es | |
| Dang Danny H | -- | None Available | |
| Dang Danny H | -- | None Available | |
| Dang Danny Huyduc | $825,000 | Fhtc | |
| Shitabata Md Paul K | -- | -- | |
| Shitabata Paul K | -- | -- |
Source: Public Records
Mortgage History
| Date | Status | Borrower | Loan Amount |
|---|---|---|---|
| Open | Dang Danny H | $535,000 | |
| Closed | Dang Danny H | $535,000 | |
| Closed | Dang Danny Huyduc | $660,000 |
Source: Public Records
Tax History
| Year | Tax Paid | Tax Assessment Tax Assessment Total Assessment is a certain percentage of the fair market value that is determined by local assessors to be the total taxable value of land and additions on the property. | Land | Improvement |
|---|---|---|---|---|
| 2025 | $4,157 | $1,424,400 | $1,050,000 | $374,400 |
| 2024 | $4,157 | $1,307,600 | $1,025,000 | $282,600 |
| 2023 | $4,015 | $1,347,100 | $1,025,000 | $322,100 |
| 2022 | $4,146 | $1,284,500 | $925,000 | $359,500 |
| 2021 | $3,942 | $1,226,400 | $850,000 | $376,400 |
| 2020 | $3,674 | $1,149,600 | $840,000 | $309,600 |
| 2019 | $3,611 | $1,111,700 | $820,000 | $291,700 |
| 2018 | $3,459 | $1,068,300 | $800,000 | $268,300 |
| 2017 | $3,295 | $1,021,300 | $760,000 | $261,300 |
| 2016 | $3,317 | $1,027,800 | $740,000 | $287,800 |
Source: Public Records
Map
Nearby Homes
- 3741 Harding Ave
- 4026 Harding Ave
- 766 Ocean View Dr
- 4049A Keanu St
- 925 Pilialo St
- 4152 Koko Dr Unit 2
- 3782 Claudine St
- 4169 Koko Dr Unit 4169
- 4185 Keanu St Unit 34
- 1103 10th Ave
- 3350 Sierra Dr Unit 601
- 4149 Kilauea Ave
- 4153 Kilauea Ave
- 4570 Ahuli Place
- 1457 Hunakai St Unit 1
- 4912 Kilauea Ave Unit 2
- 4300 Waialae Ave Unit A2002
- 4300 Waialae Ave Unit A501
- 4300 Waialae Ave Unit B601
- 4300 Waialae Ave Unit A1502
- 3928 Pahoa Ave
- 3912 Pahoa Ave
- 3910 Pahoa Ave Unit 3910
- 1012 18th Ave
- 1006 18th Ave
- 1013 17th Ave
- 3904 Pahoa Ave Unit A
- 1005 17th Ave
- 1005 17th Ave Unit B
- 1020 18th Ave Unit A
- 1020 18th Ave
- 1017 17th Ave
- 1017 17th Ave Unit Downstairs
- 3915 Pahoa Ave
- 956 18th Ave
- 3919 Pahoa Ave
- 3907 Pahoa Ave
- 955 17th Ave
- 1021 17th Ave
- 1001 18th Ave
Your Personal Tour Guide
Ask me questions while you tour the home.