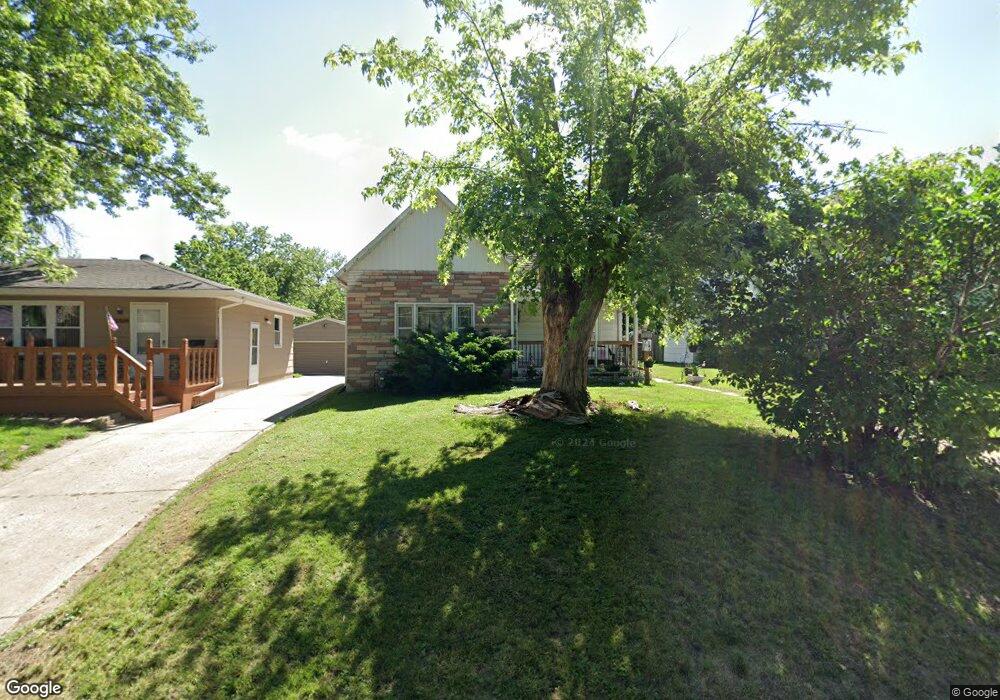
3919 13th St Des Moines, IA 50313
Oak Park NeighborhoodEstimated Value: $145,000 - $184,000
2
Beds
2
Baths
960
Sq Ft
$177/Sq Ft
Est. Value
About This Home
This home is located at 3919 13th St, Des Moines, IA 50313 and is currently estimated at $170,135, approximately $177 per square foot. 3919 13th St is a home located in Polk County with nearby schools including Oak Park Elementary School, Harding Middle School, and North High School.
Ownership History
Date
Name
Owned For
Owner Type
Purchase Details
Closed on
Feb 16, 2005
Sold by
Berbo Hajrudin and Berbo Sadika
Bought by
Guerrero Concepcion I
Current Estimated Value
Home Financials for this Owner
Home Financials are based on the most recent Mortgage that was taken out on this home.
Original Mortgage
$73,072
Outstanding Balance
$37,215
Interest Rate
5.78%
Mortgage Type
Fannie Mae Freddie Mac
Estimated Equity
$132,920
Purchase Details
Closed on
Oct 22, 2004
Sold by
Sloan Shane T and Sloan Susanne M
Bought by
Sts Properties L L C
Create a Home Valuation Report for This Property
The Home Valuation Report is an in-depth analysis detailing your home's value as well as a comparison with similar homes in the area
Home Values in the Area
Average Home Value in this Area
Purchase History
| Date | Buyer | Sale Price | Title Company |
|---|---|---|---|
| Guerrero Concepcion I | $74,500 | -- | |
| Sts Properties L L C | -- | None Available |
Source: Public Records
Mortgage History
| Date | Status | Borrower | Loan Amount |
|---|---|---|---|
| Open | Guerrero Concepcion I | $73,072 |
Source: Public Records
Tax History Compared to Growth
Tax History
| Year | Tax Paid | Tax Assessment Tax Assessment Total Assessment is a certain percentage of the fair market value that is determined by local assessors to be the total taxable value of land and additions on the property. | Land | Improvement |
|---|---|---|---|---|
| 2025 | $2,808 | $163,700 | $29,200 | $134,500 |
| 2024 | $2,808 | $142,700 | $25,400 | $117,300 |
| 2023 | $2,690 | $142,700 | $25,400 | $117,300 |
| 2022 | $2,668 | $114,100 | $21,400 | $92,700 |
| 2021 | $2,530 | $114,100 | $21,400 | $92,700 |
| 2020 | $2,628 | $101,400 | $19,200 | $82,200 |
| 2019 | $2,492 | $101,400 | $19,200 | $82,200 |
| 2018 | $2,466 | $92,700 | $17,400 | $75,300 |
| 2017 | $2,290 | $92,700 | $17,400 | $75,300 |
| 2016 | $2,232 | $84,700 | $15,700 | $69,000 |
| 2015 | $2,232 | $84,700 | $15,700 | $69,000 |
| 2014 | $2,140 | $83,600 | $15,400 | $68,200 |
Source: Public Records
Map
Nearby Homes