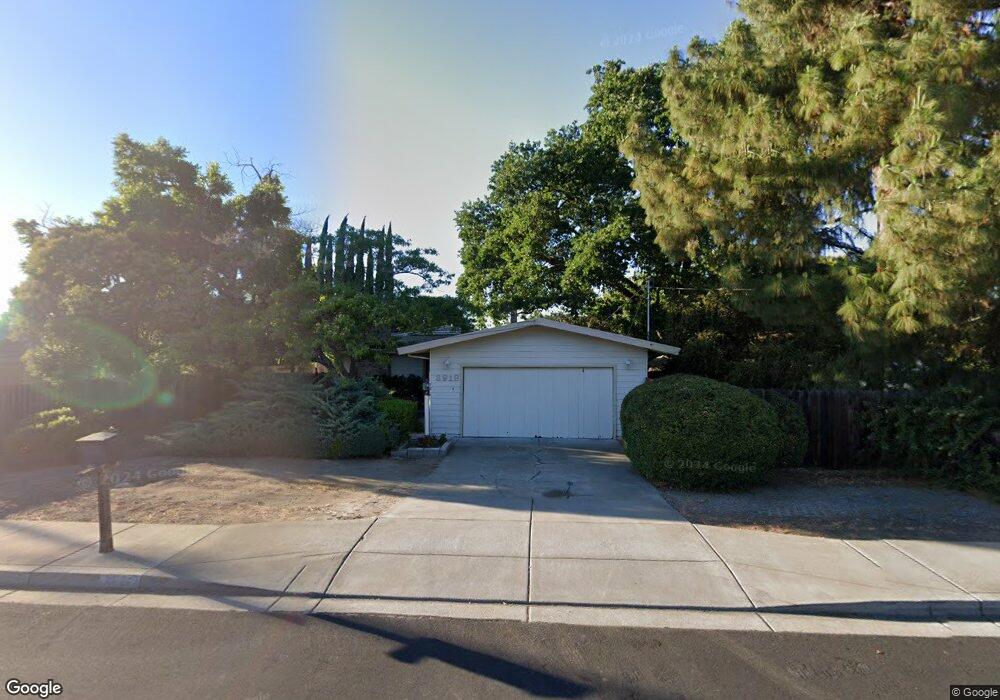
3919 Concord Blvd Concord, CA 94519
Dana Estates NeighborhoodEstimated Value: $764,899 - $799,000
About This Home
This home is located at 3919 Concord Blvd, Concord, CA 94519 and is currently estimated at $777,475, approximately $595 per square foot. 3919 Concord Blvd is a home located in Contra Costa County with nearby schools including Westwood Elementary School, El Dorado Middle School, and Concord High School.
Ownership History
We collect this data history from publicly available records. To have your information removed, we recommend requesting removal directly through your county’s website.
Purchase Details
Home Financials for this Owner
Home Financials are based on the most recent Mortgage that was taken out on this home.Purchase Details
Purchase Details
Home Financials for this Owner
Home Financials are based on the most recent Mortgage that was taken out on this home.Home Values in the Area
Average Home Value in this Area
Purchase History
We collect this data history from publicly available records. To have your information removed, we recommend requesting removal directly through your county’s website.
| Date | Buyer | Sale Price | Title Company |
|---|---|---|---|
| -- | Placer Title Company | ||
| -- | Placer Title Company | ||
| $401,000 | Placer Title Company | ||
| -- | -- | ||
| $295,000 | Fidelity National Title Co |
Mortgage History
We collect this data history from publicly available records. To have your information removed, we recommend requesting removal directly through your county’s website.
| Date | Status | Borrower | Loan Amount |
|---|---|---|---|
| Open | $359,900 | ||
| Previous Owner | $200,000 |
Tax History
We collect this data history from publicly available records. To have your information removed, we recommend requesting removal directly through your county’s website.
| Year | Tax Paid | Tax Assessment Tax Assessment Total Assessment is a certain percentage of the fair market value that is determined by local assessors to be the total taxable value of land and additions on the property. | Land | Improvement |
|---|---|---|---|---|
| 2025 | $6,634 | $516,375 | $341,251 | $175,124 |
| 2024 | $6,331 | $506,251 | $334,560 | $171,691 |
| 2023 | $6,331 | $496,325 | $328,000 | $168,325 |
| 2022 | $6,240 | $486,594 | $321,569 | $165,025 |
| 2021 | $6,081 | $477,054 | $315,264 | $161,790 |
| 2019 | $5,960 | $462,907 | $305,914 | $156,993 |
| 2018 | $5,731 | $453,831 | $299,916 | $153,915 |
| 2017 | $5,536 | $444,934 | $294,036 | $150,898 |
| 2016 | $5,378 | $436,211 | $288,271 | $147,940 |
| 2015 | $4,869 | $390,000 | $257,732 | $132,268 |
| 2014 | $4,147 | $326,500 | $215,768 | $110,732 |
Map
- 1740 Clayton Way
- 1815 Granada Dr
- 3824 Beechwood Dr
- 55 Ceemar Ct
- 1849 Silverwood Dr
- 3622 Delancey Ln
- 0 Walnut Ave
- 3882 Chestnut Ave
- 4050 Sacramento St
- 1878 Queens Rd
- 3997 Mulberry Dr
- 1675 Garnet Ln
- 1514 Farm Bureau Rd
- 3641 Clayton Rd Unit 12
- 3641 Clayton Rd Unit 37
- 3641 Clayton Rd Unit 34
- 1869 Landana Dr
- 4092 Nulty Dr
- 3905 Clayton Rd Unit 12
- 3901 Clayton Rd Unit 23
- 1787 Granada Dr
- 1785 Granada Dr
- 1789 Granada Dr
- 3925 Concord Blvd
- 1781 Granada Dr
- 1791 Granada Dr
- 1808 Gross Ln
- 1786 Granada Dr
- 1784 Granada Dr
- 1802 Gross Ln
- 1788 Granada Dr
- 1780 Granada Dr
- 1793 Granada Dr
- 1779 Granada Dr
- 3979 Concord Blvd
- 3606 Hammond Place
- 1814 Gross Ln
- 3612 Hammond Place
- 1776 Granada Dr
- 1775 Granada Dr
Ask me questions while you tour the home.