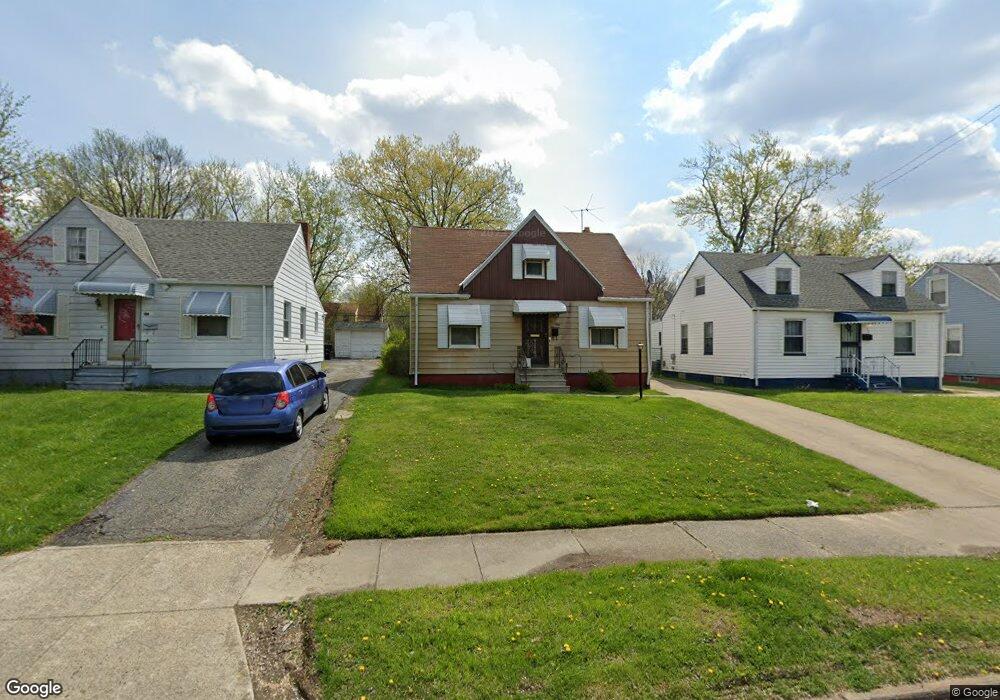
3919 E 177th St Cleveland, OH 44128
Lee-Miles NeighborhoodEstimated Value: $90,000 - $108,570
4
Beds
2
Baths
1,066
Sq Ft
$94/Sq Ft
Est. Value
About This Home
This home is located at 3919 E 177th St, Cleveland, OH 44128 and is currently estimated at $100,643, approximately $94 per square foot. 3919 E 177th St is a home located in Cuyahoga County with nearby schools including Citizens Academy Southeast.
Ownership History
Date
Name
Owned For
Owner Type
Purchase Details
Closed on
Oct 20, 2006
Sold by
Fortson Annie M and Fortson Willie O
Bought by
Fortson Annie M and Fortson Willie O
Current Estimated Value
Home Financials for this Owner
Home Financials are based on the most recent Mortgage that was taken out on this home.
Original Mortgage
$90,100
Outstanding Balance
$52,480
Interest Rate
6.5%
Mortgage Type
New Conventional
Estimated Equity
$48,163
Purchase Details
Closed on
Oct 28, 1997
Sold by
Fortson Annie M and Fortson Annie Mae
Bought by
Fortson Annie M and Fortson Willie O
Purchase Details
Closed on
Jul 24, 1979
Sold by
Johnson Jerome and Johnson Beverly
Bought by
Fortson Annie Mae
Purchase Details
Closed on
Oct 23, 1975
Sold by
Williams Thelma
Bought by
Johnson Jerome and Johnson Beverly
Purchase Details
Closed on
Jan 1, 1975
Bought by
Williams Thelma
Create a Home Valuation Report for This Property
The Home Valuation Report is an in-depth analysis detailing your home's value as well as a comparison with similar homes in the area
Home Values in the Area
Average Home Value in this Area
Purchase History
| Date | Buyer | Sale Price | Title Company |
|---|---|---|---|
| Fortson Annie M | -- | Premier Title Solutions Ltd | |
| Fortson Annie M | -- | Tower City Title Agency Inc | |
| Fortson Annie Mae | $37,000 | -- | |
| Johnson Jerome | $23,900 | -- | |
| Williams Thelma | -- | -- |
Source: Public Records
Mortgage History
| Date | Status | Borrower | Loan Amount |
|---|---|---|---|
| Open | Fortson Annie M | $90,100 |
Source: Public Records
Tax History
| Year | Tax Paid | Tax Assessment Tax Assessment Total Assessment is a certain percentage of the fair market value that is determined by local assessors to be the total taxable value of land and additions on the property. | Land | Improvement |
|---|---|---|---|---|
| 2025 | $1,515 | $33,250 | $6,510 | $26,740 |
| 2024 | $1,537 | $33,250 | $6,510 | $26,740 |
| 2023 | $1,081 | $23,420 | $5,640 | $17,780 |
| 2022 | $1,106 | $23,420 | $5,640 | $17,780 |
| 2021 | $1,095 | $23,420 | $5,640 | $17,780 |
| 2020 | $973 | $20,020 | $4,830 | $15,190 |
| 2019 | $900 | $57,200 | $13,800 | $43,400 |
| 2018 | $897 | $20,020 | $4,830 | $15,190 |
| 2017 | $1,085 | $21,910 | $6,300 | $15,610 |
| 2016 | $1,077 | $21,910 | $6,300 | $15,610 |
| 2015 | $1,047 | $21,910 | $6,300 | $15,610 |
| 2014 | $1,047 | $21,490 | $6,160 | $15,330 |
Source: Public Records
Map
Nearby Homes
- 3925 Strandhill Rd
- 17418 Biltmore Ave
- 3983 E 176th St
- 3852 Lee Heights Blvd
- 3977 Wendy Dr
- 17425 Walden Ave
- 17404 Throckley Ave
- 18310 Harvard Ave
- 16811 Biltmore Ave
- 16909 Harvard Ave
- 16812 Talford Ave
- 16908 Throckley Ave
- 16705 Glendale Ave
- 3722 Glencairn Rd
- 16702 Glendale Ave
- 18506 Scottsdale Blvd
- 4001 E 189th St
- 16512 Stockbridge Ave
- 16811 Invermere Ave
- 3703 Riedham Rd
- 3923 E 177th St
- 3911 E 177th St
- 3927 E 177th St
- 3918 Lee Heights Blvd
- 3907 E 177th St
- 3931 E 177th St
- 3914 Lee Heights Blvd
- 3922 Lee Heights Blvd
- 3910 Lee Heights Blvd
- 3926 Lee Heights Blvd
- 3903 E 177th St
- 3918 E 177th St
- 3935 E 177th St
- 3922 E 177th St
- 3914 E 177th St
- 3906 Lee Heights Blvd
- 3926 E 177th St
- 3930 Lee Heights Blvd
- 3910 E 177th St
- 3930 E 177th St
Your Personal Tour Guide
Ask me questions while you tour the home.