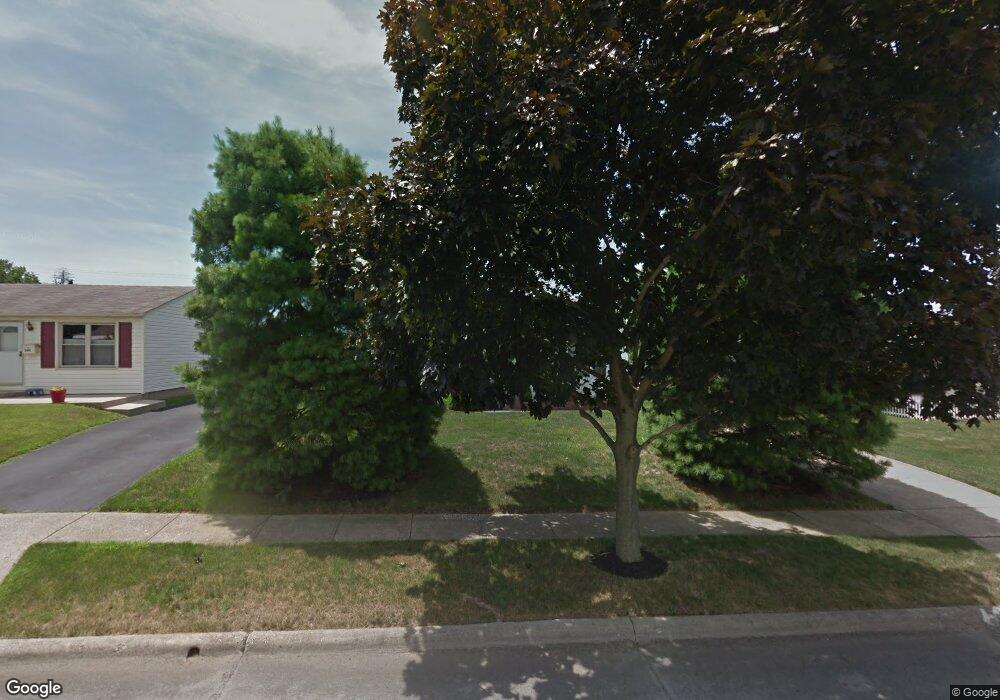
3919 Lexmont Rd S Columbus, OH 43228
Holly Hill NeighborhoodEstimated Value: $175,000 - $198,000
3
Beds
1
Bath
944
Sq Ft
$197/Sq Ft
Est. Value
About This Home
This home is located at 3919 Lexmont Rd S, Columbus, OH 43228 and is currently estimated at $186,231, approximately $197 per square foot. 3919 Lexmont Rd S is a home located in Franklin County with nearby schools including Georgian Heights Alt Elementary School, Wedgewood Middle School, and Briggs High School.
Ownership History
Date
Name
Owned For
Owner Type
Purchase Details
Closed on
Aug 17, 2018
Sold by
Bryan Carol A O
Bought by
Bryan Robert P O and Dickson Deborah A
Current Estimated Value
Purchase Details
Closed on
May 13, 1964
Bought by
Obryan Robert H and Obryan Carol A
Create a Home Valuation Report for This Property
The Home Valuation Report is an in-depth analysis detailing your home's value as well as a comparison with similar homes in the area
Home Values in the Area
Average Home Value in this Area
Purchase History
| Date | Buyer | Sale Price | Title Company |
|---|---|---|---|
| Bryan Robert P O | -- | None Available | |
| Obryan Robert H | -- | -- |
Source: Public Records
Tax History Compared to Growth
Tax History
| Year | Tax Paid | Tax Assessment Tax Assessment Total Assessment is a certain percentage of the fair market value that is determined by local assessors to be the total taxable value of land and additions on the property. | Land | Improvement |
|---|---|---|---|---|
| 2024 | $2,239 | $59,680 | $16,000 | $43,680 |
| 2023 | $2,238 | $59,675 | $15,995 | $43,680 |
| 2022 | $1,225 | $32,200 | $6,790 | $25,410 |
| 2021 | $1,218 | $32,200 | $6,790 | $25,410 |
| 2020 | $1,220 | $32,200 | $6,790 | $25,410 |
| 2019 | $1,068 | $26,360 | $5,670 | $20,690 |
| 2018 | $1,046 | $26,360 | $5,670 | $20,690 |
| 2017 | $1,099 | $26,360 | $5,670 | $20,690 |
| 2016 | $1,129 | $25,800 | $5,180 | $20,620 |
| 2015 | $1,025 | $25,800 | $5,180 | $20,620 |
| 2014 | $1,028 | $25,800 | $5,180 | $20,620 |
| 2013 | $642 | $30,345 | $6,090 | $24,255 |
Source: Public Records
Map
Nearby Homes
- 3814 Clime Rd
- 3727-3729 Briggs Rd
- 3997 Briggs Rd
- 3728 Greenock Ct
- 3551 Glorious Rd
- 3874 Eakin Rd
- 829 Crevis Ln
- 4190 Salem Dr
- 756 Brixham Rd
- 4146 Sexton Dr
- 1243 Trevor Ct
- 4201 Sexton Dr
- 673 Roth Ave
- 4459 Amwood St
- 4212 Sexton Dr
- 1485 Demorest Rd
- 4419 Hammerton Dr Unit 13D
- 4483 White Leaf Way
- 3360 Briggs Rd
- 3766 Dunlane Ct
- 3911 Lexmont Rd S
- 3925 Lexmont Rd S
- 3903 Lexmont Rd S
- 3933 Lexmont Rd S
- 3916 Lexmont Rd S
- 3924 Lexmont Rd S
- 3895 Lexmont Rd S
- 3908 Lexmont Rd S
- 3900 Lexmont Rd S
- 3912 Clime Rd
- 3937 Lexmont Rd S
- 3887 Lexmont Rd S
- 1102 Lexmont Rd
- 3892 Lexmont Rd S
- 3942 Clime Rd
- 1111 Lexmont Rd
- 1097 Ardath Ct
- 3884 Lexmont Rd S
- 1103 Lexmont Rd
- 1094 Lexmont Rd