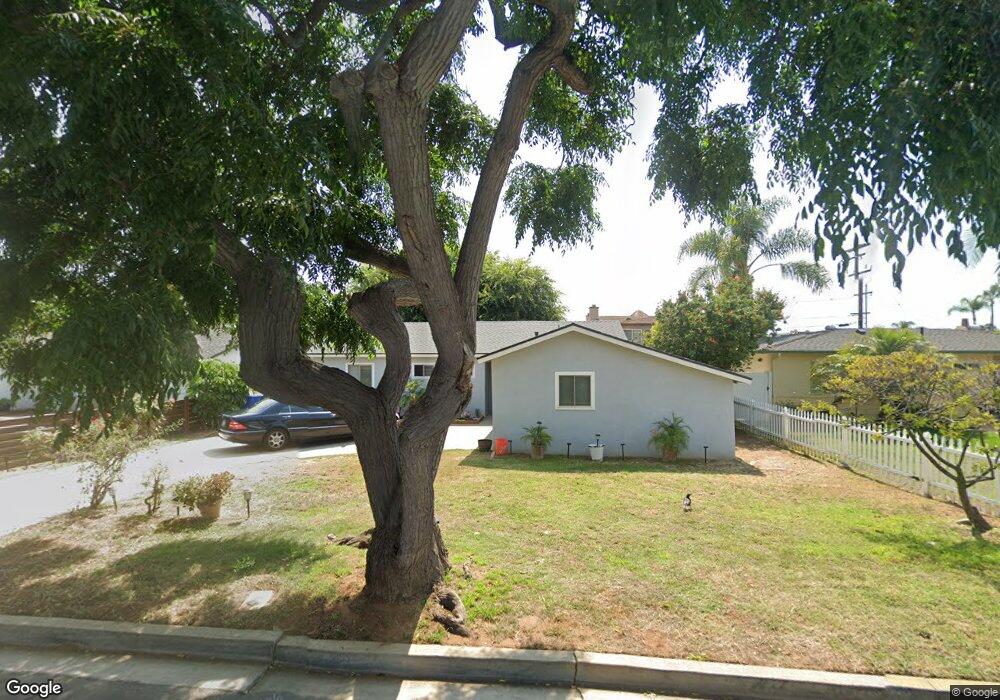
3919 Linmar Ln Carlsbad, CA 92008
North Beach NeighborhoodEstimated Value: $1,295,000 - $1,789,000
3
Beds
2
Baths
1,160
Sq Ft
$1,294/Sq Ft
Est. Value
About This Home
This home is located at 3919 Linmar Ln, Carlsbad, CA 92008 and is currently estimated at $1,501,291, approximately $1,294 per square foot. 3919 Linmar Ln is a home located in San Diego County with nearby schools including Carlsbad High School, Sage Creek High, and St. Patrick Catholic School.
Ownership History
Date
Name
Owned For
Owner Type
Purchase Details
Closed on
Mar 22, 2023
Sold by
Harrington R F R and Harrington Sabrina
Bought by
Harrington Family Trust
Current Estimated Value
Purchase Details
Closed on
Jun 25, 2013
Sold by
Harrington Karen Lynn
Bought by
Harrington Robert F and Harrington Sabrina
Purchase Details
Closed on
Aug 3, 2012
Sold by
Harrington Robert F and Harrington Sabrina
Bought by
Harrington Robert F and Harrington Sabrina
Home Financials for this Owner
Home Financials are based on the most recent Mortgage that was taken out on this home.
Original Mortgage
$270,000
Interest Rate
2.91%
Mortgage Type
New Conventional
Create a Home Valuation Report for This Property
The Home Valuation Report is an in-depth analysis detailing your home's value as well as a comparison with similar homes in the area
Home Values in the Area
Average Home Value in this Area
Purchase History
| Date | Buyer | Sale Price | Title Company |
|---|---|---|---|
| Harrington Family Trust | -- | -- | |
| Harrington Robert F | -- | None Available | |
| Harrington Robert F | -- | Chicago Title |
Source: Public Records
Mortgage History
| Date | Status | Borrower | Loan Amount |
|---|---|---|---|
| Previous Owner | Harrington Robert F | $270,000 |
Source: Public Records
Tax History
| Year | Tax Paid | Tax Assessment Tax Assessment Total Assessment is a certain percentage of the fair market value that is determined by local assessors to be the total taxable value of land and additions on the property. | Land | Improvement |
|---|---|---|---|---|
| 2025 | $2,760 | $263,050 | $169,680 | $93,370 |
| 2024 | $2,760 | $257,893 | $166,353 | $91,540 |
| 2023 | $2,743 | $247,882 | $159,895 | $87,987 |
| 2022 | $2,700 | $247,882 | $159,895 | $87,987 |
| 2021 | $2,679 | $243,022 | $156,760 | $86,262 |
| 2020 | $2,661 | $240,531 | $155,153 | $85,378 |
| 2019 | $2,613 | $235,815 | $152,111 | $83,704 |
| 2018 | $2,503 | $231,192 | $149,129 | $82,063 |
| 2017 | $2,461 | $226,659 | $146,205 | $80,454 |
| 2016 | $2,362 | $222,216 | $143,339 | $78,877 |
| 2015 | $2,352 | $218,879 | $141,186 | $77,693 |
| 2014 | $2,313 | $214,593 | $138,421 | $76,172 |
Source: Public Records
Map
Nearby Homes
- 4008 Aguila St Unit I
- 4011 Layang Cir Unit F
- 324 Chinquapin Ave
- 318 Chinquapin Ave
- 320 Chinquapin Ave
- 370 Tamarack Ave
- 4020 Layang Cir Unit C
- 363 Hemlock Ave Unit C
- 4031 Aidan Cir Unit 1205
- 4332 Adams St
- 4340 Adams St
- 256 Juniper Ave Unit B6
- 3880 Adams St
- 3747 Adams St
- 378 Acacia Ave
- 4235 Harrison St
- 150 Juniper Ave
- 141 Cherry Ave
- 1199 Tamarack Ave
- 175 Maple Ave Unit 4
- 3915 Linmar Ln
- 3910 Sheridan Place
- 3935 Linmar Ln
- 3906 Sheridan Place
- 3901 Linmar Ln
- 3902 Sheridan Place
- 3920 Linmar Ln
- 3914 Sheridan Place
- 3914 Linmar Ln
- 3926 Linmar Ln
- 3945 Linmar Ln
- 3936 Linmar Ln
- 3900 Linmar Ln
- 0 Sheridan Place
- 3918 Sheridan Place
- 3946 Linmar Ln
- 3955 Linmar Ln
- 3911 Sheridan Place
- 3919 Jefferson St
- 3915 Jefferson St
Your Personal Tour Guide
Ask me questions while you tour the home.