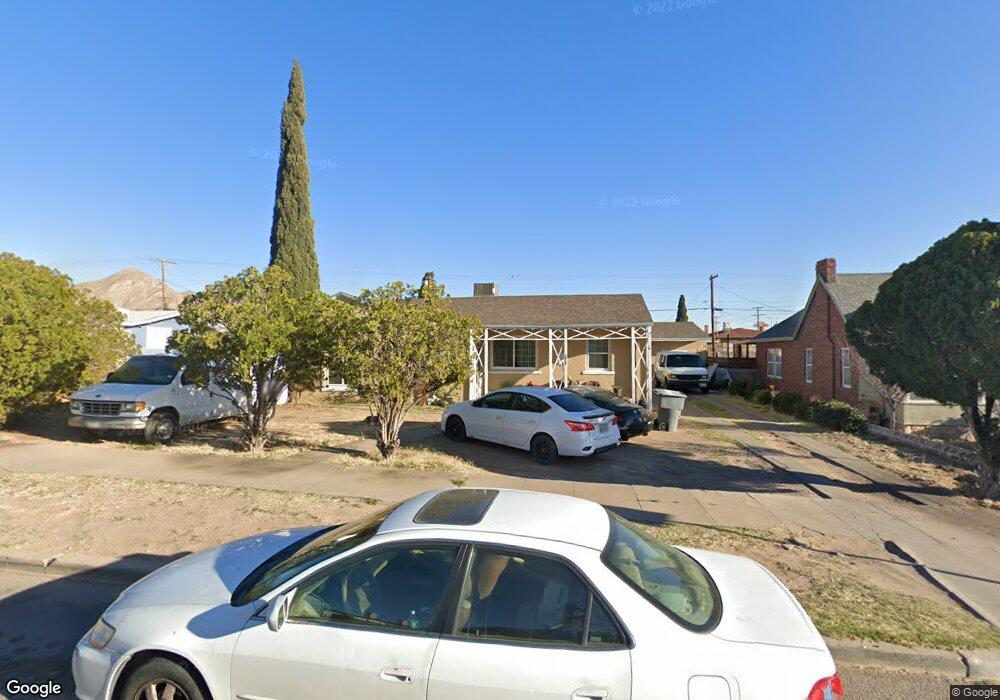
3919 Mckinley Ave El Paso, TX 79930
Central NeighborhoodEstimated Value: $234,000 - $305,000
4
Beds
3
Baths
2,341
Sq Ft
$110/Sq Ft
Est. Value
About This Home
This home is located at 3919 Mckinley Ave, El Paso, TX 79930 and is currently estimated at $257,902, approximately $110 per square foot. 3919 Mckinley Ave is a home located in El Paso County with nearby schools including Rusk Elementary School, Middle School-5 NW Middle, and Austin High School.
Ownership History
Date
Name
Owned For
Owner Type
Purchase Details
Closed on
Jan 23, 2017
Sold by
Louloupides Kyriacos and Catarino Marta Alicia
Bought by
Louloupides Kyriacos and Louloupides Martha Alicia Catarino
Current Estimated Value
Purchase Details
Closed on
Mar 11, 2008
Sold by
Catarino Rafael
Bought by
Louloupides Kyriacos and Catarino Marta Alicia
Purchase Details
Closed on
Mar 3, 2000
Sold by
Rascon Arturo and Rascon Hilda M
Bought by
Catarino Rafael
Home Financials for this Owner
Home Financials are based on the most recent Mortgage that was taken out on this home.
Original Mortgage
$68,400
Interest Rate
8.31%
Purchase Details
Closed on
Jan 15, 1998
Sold by
Klespis Anthony J
Bought by
Rascan Arturo and Rascon Hilda M
Home Financials for this Owner
Home Financials are based on the most recent Mortgage that was taken out on this home.
Original Mortgage
$49,440
Interest Rate
8.99%
Create a Home Valuation Report for This Property
The Home Valuation Report is an in-depth analysis detailing your home's value as well as a comparison with similar homes in the area
Home Values in the Area
Average Home Value in this Area
Purchase History
| Date | Buyer | Sale Price | Title Company |
|---|---|---|---|
| Louloupides Kyriacos | -- | None Available | |
| Louloupides Kyriacos | -- | None Available | |
| Catarino Rafael | -- | -- | |
| Rascan Arturo | -- | -- |
Source: Public Records
Mortgage History
| Date | Status | Borrower | Loan Amount |
|---|---|---|---|
| Previous Owner | Catarino Rafael | $68,400 | |
| Previous Owner | Rascan Arturo | $49,440 | |
| Closed | Rascan Arturo | $12,360 |
Source: Public Records
Tax History Compared to Growth
Tax History
| Year | Tax Paid | Tax Assessment Tax Assessment Total Assessment is a certain percentage of the fair market value that is determined by local assessors to be the total taxable value of land and additions on the property. | Land | Improvement |
|---|---|---|---|---|
| 2025 | $2,073 | $185,286 | -- | -- |
| 2024 | $2,073 | $168,442 | -- | -- |
| 2023 | $1,979 | $153,129 | $0 | $0 |
| 2022 | $4,121 | $139,208 | $0 | $0 |
| 2021 | $3,951 | $126,632 | $17,199 | $109,433 |
| 2020 | $3,536 | $115,048 | $17,199 | $97,849 |
| 2018 | $3,385 | $115,732 | $17,199 | $98,533 |
| 2017 | $2,928 | $103,963 | $17,199 | $86,764 |
| 2016 | $2,928 | $103,963 | $17,199 | $86,764 |
| 2015 | $3,202 | $112,639 | $17,199 | $95,440 |
| 2014 | $3,202 | $125,894 | $17,199 | $108,695 |
Source: Public Records
Map
Nearby Homes
- 3901 Mckinley Ave
- 3831 Mountain Ave
- 3921 Nations Ave
- 3905 Monroe Ave
- 3806 Mountain Ave
- 3704 Mckinley Ave
- 3606 Morehead Ave
- 3827 Idalia Ave
- 3906 Taylor Ave
- 3413 Monroe Ave
- 3510 Porter Ave
- 3501 Polk Ave
- 3921 Mobile Ave
- 3501 Taylor Ave
- 3427 Hamilton Ave
- 3905 Nashville Ave
- 3312 Polk Ave
- 4029 Lincoln Ave
- 3524 Mobile Ave
- 3808 Johnson Ave
- 3925 Mckinley Ave
- 3915 Mckinley Ave
- 3929 Mckinley Ave
- 3918 Jackson Ave
- 3931 Mckinley Ave
- 3922 Jackson Ave
- 3914 Jackson Ave
- 3926 Jackson Ave
- 3908 Jackson Ave
- 3918 Mckinley Ave
- 3916 Mckinley Ave
- 3920 Mckinley Ave
- 3930 Jackson Ave
- 3912 Mckinley Ave
- 3718 Partello St
- 3904 Mckinley Ave
- 3900 Jackson Ave
- 3900 Jackson Ave Unit 3902
- 3900 Mckinley Ave
- 3917 Jackson Ave