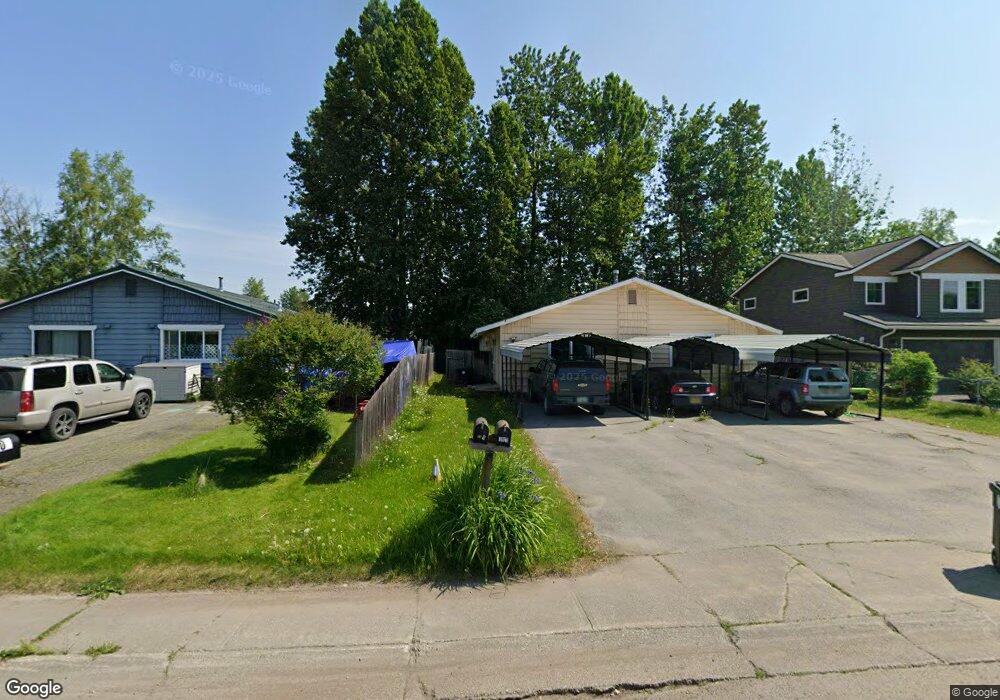
3919 Randolph St Anchorage, AK 99508
Tudor Area NeighborhoodEstimated Value: $186,000 - $420,000
4
Beds
2
Baths
1,800
Sq Ft
$188/Sq Ft
Est. Value
About This Home
This home is located at 3919 Randolph St, Anchorage, AK 99508 and is currently estimated at $338,400, approximately $188 per square foot. 3919 Randolph St is a home located in Anchorage Municipality with nearby schools including Lake Otis Elementary School, Wendler Middle School, and Bettye Davis East Anchorage High School.
Ownership History
Date
Name
Owned For
Owner Type
Purchase Details
Closed on
Jun 12, 2022
Sold by
Dedych Peter T
Bought by
Dedych Luke R
Current Estimated Value
Purchase Details
Closed on
Jun 29, 2006
Sold by
Wilker Shannon B
Bought by
Dedych Luke P and Dedych Peter T
Home Financials for this Owner
Home Financials are based on the most recent Mortgage that was taken out on this home.
Original Mortgage
$211,920
Interest Rate
6.57%
Mortgage Type
Purchase Money Mortgage
Purchase Details
Closed on
Dec 23, 2002
Sold by
Johnson Elmer R
Bought by
Wilker Shannon B
Home Financials for this Owner
Home Financials are based on the most recent Mortgage that was taken out on this home.
Original Mortgage
$188,485
Interest Rate
6.03%
Mortgage Type
FHA
Purchase Details
Closed on
Jul 31, 2002
Sold by
Coulson Eddie R and Coulson Eddie R
Bought by
Johnson Elmer R
Home Financials for this Owner
Home Financials are based on the most recent Mortgage that was taken out on this home.
Original Mortgage
$159,650
Interest Rate
6.6%
Mortgage Type
VA
Create a Home Valuation Report for This Property
The Home Valuation Report is an in-depth analysis detailing your home's value as well as a comparison with similar homes in the area
Home Values in the Area
Average Home Value in this Area
Purchase History
| Date | Buyer | Sale Price | Title Company |
|---|---|---|---|
| Dedych Luke R | -- | None Listed On Document | |
| Dedych Luke P | -- | None Available | |
| Wilker Shannon B | -- | -- | |
| Johnson Elmer R | -- | -- |
Source: Public Records
Mortgage History
| Date | Status | Borrower | Loan Amount |
|---|---|---|---|
| Previous Owner | Dedych Luke P | $211,920 | |
| Previous Owner | Wilker Shannon B | $188,485 | |
| Previous Owner | Johnson Elmer R | $159,650 |
Source: Public Records
Tax History
| Year | Tax Paid | Tax Assessment Tax Assessment Total Assessment is a certain percentage of the fair market value that is determined by local assessors to be the total taxable value of land and additions on the property. | Land | Improvement |
|---|---|---|---|---|
| 2025 | $4,162 | $349,500 | $106,900 | $242,600 |
| 2024 | $4,162 | $332,800 | $106,900 | $225,900 |
| 2023 | $5,523 | $324,300 | $106,900 | $217,400 |
| 2022 | $4,596 | $322,900 | $106,900 | $216,000 |
| 2021 | $5,332 | $295,900 | $106,900 | $189,000 |
| 2020 | $4,301 | $303,300 | $106,900 | $196,400 |
| 2019 | $4,119 | $301,800 | $106,900 | $194,900 |
| 2018 | $4,108 | $300,500 | $109,100 | $191,400 |
| 2017 | $4,316 | $295,600 | $103,600 | $192,000 |
| 2016 | $3,854 | $292,700 | $103,600 | $189,100 |
| 2015 | $3,854 | $273,000 | $94,500 | $178,500 |
| 2014 | $3,854 | $261,000 | $89,600 | $171,400 |
Source: Public Records
Map
Nearby Homes
- 1819 E Tudor Rd Unit B102
- 4230 Folker St Unit A-103
- 4241 Folker St Unit D203
- 3327 Wentworth St
- 3421 Cottonwood St
- 1634 Stanford Dr
- 2830 Happy Ln Unit 13
- 2090 Dimond Dr
- 4510 Wright St Unit 23
- 4510 Wright St Unit 17
- 4510 Wright St Unit 26
- 3276 Vassar Dr
- 4530 Wright St Unit 12
- 4801 Shelikof St
- 4416 Piper St
- 1715 Bartlett Dr
- 1506 Cache Dr
- 5251 Little Tree St
- 4514 Grumman St
- L9A Laurel St
- 3901 Randolph St
- 3935 Randolph St
- 3853 Randolph St
- 3855 Randolph St
- 3920 Young St
- 3910 Young St
- 3930 Young St
- 3845 Randolph St
- 3843 Randolph St
- 3900 Young St
- 3912 Randolph St
- 3934 Randolph St
- 2050 E 39th Ave
- 3936 Randolph St
- 2040 E 39th Ave
- 2021 Salem Ct
- 3835 Randolph St
- 3924 Randolph St
- 3848 Young St
- 3848 Young St