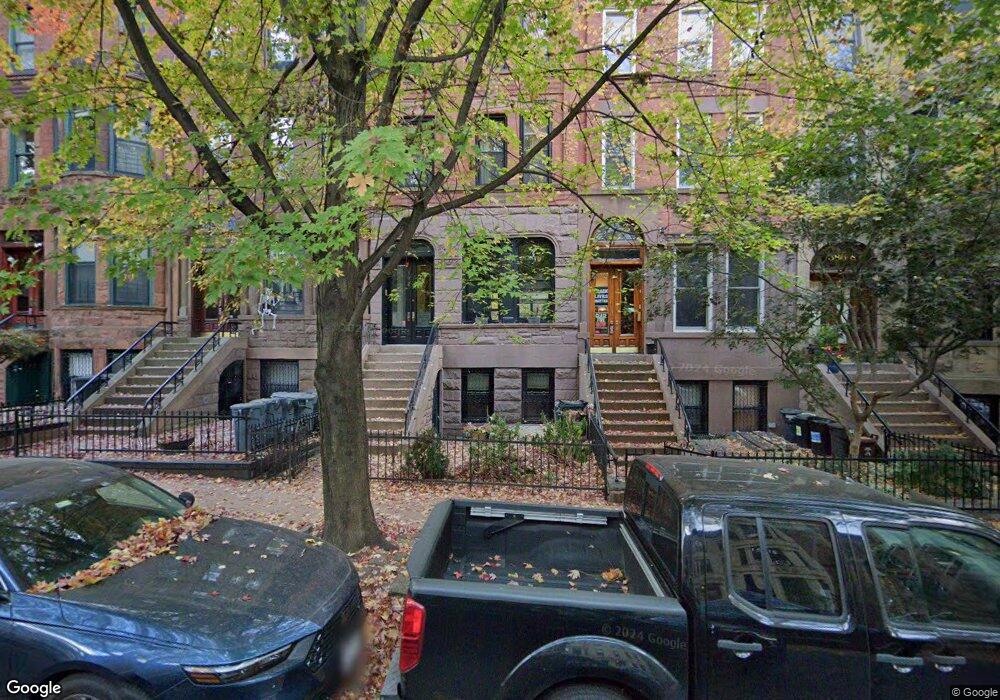
392 4th St Brooklyn, NY 11215
Park Slope NeighborhoodEstimated Value: $3,924,000 - $5,574,257
Studio
--
Bath
3,620
Sq Ft
$1,226/Sq Ft
Est. Value
About This Home
This home is located at 392 4th St, Brooklyn, NY 11215 and is currently estimated at $4,439,814, approximately $1,226 per square foot. 392 4th St is a home located in Kings County with nearby schools including P.S. 321 William Penn, Saint Saviour Catholic Academy, and Berkeley Carroll Elementary School.
Ownership History
Date
Name
Owned For
Owner Type
Purchase Details
Closed on
Oct 21, 2015
Sold by
Gold Steven R
Bought by
Gold Steven R and Steven R Gold Living Trust
Current Estimated Value
Purchase Details
Closed on
Oct 12, 1999
Sold by
Nieves Hector
Bought by
Gold Steven R and Bernstein Gold Gail
Home Financials for this Owner
Home Financials are based on the most recent Mortgage that was taken out on this home.
Original Mortgage
$488,000
Interest Rate
7%
Purchase Details
Closed on
Mar 6, 1995
Sold by
Ortega Lisa
Bought by
Nieves Hector and Nieves Carmen
Home Financials for this Owner
Home Financials are based on the most recent Mortgage that was taken out on this home.
Original Mortgage
$180,000
Interest Rate
8.22%
Purchase Details
Closed on
Oct 30, 1992
Sold by
Vazquez Edgardo
Bought by
Nieves Hector and Nieves Carmen
Create a Home Valuation Report for This Property
The Home Valuation Report is an in-depth analysis detailing your home's value as well as a comparison with similar homes in the area
Home Values in the Area
Average Home Value in this Area
Purchase History
| Date | Buyer | Sale Price | Title Company |
|---|---|---|---|
| Gold Steven R | -- | -- | |
| Gold Steven R | $610,000 | Fidelity National Title Ins | |
| Nieves Hector | -- | -- | |
| Nieves Hector | -- | Chicago Title Insurance Co | |
| Nieves Hector | -- | Chicago Title Insurance Co | |
| Nieves Hector | -- | Chicago Title Insurance Co |
Source: Public Records
Mortgage History
| Date | Status | Borrower | Loan Amount |
|---|---|---|---|
| Previous Owner | Gold Steven R | $488,000 | |
| Previous Owner | Nieves Hector | $180,000 |
Source: Public Records
Tax History
| Year | Tax Paid | Tax Assessment Tax Assessment Total Assessment is a certain percentage of the fair market value that is determined by local assessors to be the total taxable value of land and additions on the property. | Land | Improvement |
|---|---|---|---|---|
| 2025 | $11,772 | $264,720 | $38,040 | $226,680 |
| 2024 | $11,772 | $311,460 | $38,040 | $273,420 |
| 2023 | $11,292 | $275,280 | $38,040 | $237,240 |
| 2022 | $10,499 | $234,360 | $38,040 | $196,320 |
| 2021 | $10,772 | $211,260 | $38,040 | $173,220 |
| 2019 | $9,924 | $224,760 | $38,040 | $186,720 |
| 2018 | $9,147 | $46,333 | $8,221 | $38,112 |
| 2017 | $8,634 | $43,826 | $8,461 | $35,365 |
| 2016 | $8,451 | $43,826 | $8,691 | $35,135 |
| 2015 | $4,767 | $43,089 | $11,831 | $31,258 |
| 2014 | $4,767 | $40,702 | $13,409 | $27,293 |
Source: Public Records
Map
Nearby Homes
- 347 6th Ave Unit 1
- 433 3rd St Unit 3
- 441 3rd St Unit 2L
- 357 4th St
- 445 5th Ave Unit 24F
- 445 5th Ave Unit 27H
- 445 5th Ave Unit 27-28B
- 445 5th Ave Unit 28E
- 445 5th Ave Unit 21A
- 445 5th Ave Unit 29H
- 333 4th St Unit 2A
- 333 4th St Unit 5G
- 385 6th Ave
- 291 6th Ave Unit 3
- 291 6th Ave Unit 4
- 291 6th Ave Unit 2
- 327 4th St Unit 4C
- 457 6th St
- 258 7th Ave
- 379 7th St
Your Personal Tour Guide
Ask me questions while you tour the home.