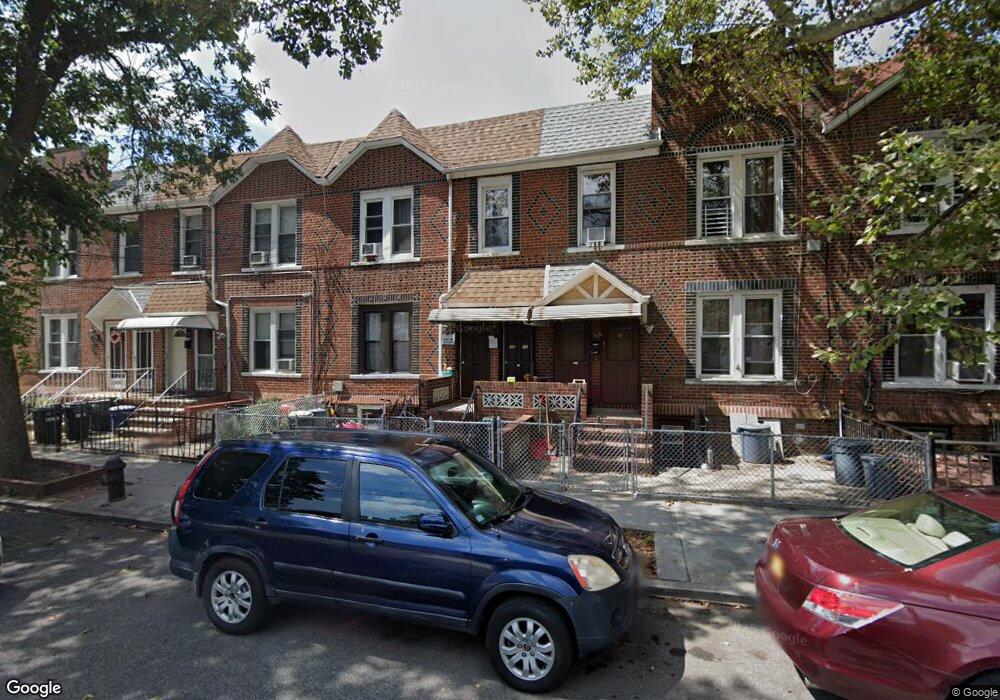
392 Drew St Brooklyn, NY 11208
East New York NeighborhoodEstimated Value: $858,015 - $1,025,000
--
Bed
--
Bath
2,136
Sq Ft
$445/Sq Ft
Est. Value
About This Home
This home is located at 392 Drew St, Brooklyn, NY 11208 and is currently estimated at $950,338, approximately $444 per square foot. 392 Drew St is a home located in Kings County with nearby schools including P.S. 214 - Michael Friedsam, Cypress Hills Ascend Charter Lower School, and Followers of Jesus School.
Ownership History
Date
Name
Owned For
Owner Type
Purchase Details
Closed on
Feb 15, 2004
Sold by
Ali Mohammed I
Bought by
Uddin Mohammed N
Current Estimated Value
Purchase Details
Closed on
Oct 31, 2001
Sold by
Mclaren James R and Todino Carolyn
Bought by
Ali Mohammed Izzad
Home Financials for this Owner
Home Financials are based on the most recent Mortgage that was taken out on this home.
Original Mortgage
$240,000
Outstanding Balance
$91,335
Interest Rate
6.66%
Mortgage Type
Purchase Money Mortgage
Estimated Equity
$859,003
Purchase Details
Closed on
May 3, 2000
Sold by
Mclaren James R
Bought by
Mclaren James R and Todino Carolyn
Create a Home Valuation Report for This Property
The Home Valuation Report is an in-depth analysis detailing your home's value as well as a comparison with similar homes in the area
Home Values in the Area
Average Home Value in this Area
Purchase History
| Date | Buyer | Sale Price | Title Company |
|---|---|---|---|
| Uddin Mohammed N | -- | -- | |
| Uddin Mohammed N | -- | -- | |
| Ali Mohammed Izzad | -- | -- | |
| Ali Mohammed Izzad | -- | -- | |
| Mclaren James R | -- | -- | |
| Mclaren James R | -- | -- |
Source: Public Records
Mortgage History
| Date | Status | Borrower | Loan Amount |
|---|---|---|---|
| Open | Ali Mohammed Izzad | $240,000 | |
| Closed | Ali Mohammed Izzad | $240,000 |
Source: Public Records
Tax History Compared to Growth
Tax History
| Year | Tax Paid | Tax Assessment Tax Assessment Total Assessment is a certain percentage of the fair market value that is determined by local assessors to be the total taxable value of land and additions on the property. | Land | Improvement |
|---|---|---|---|---|
| 2025 | $6,992 | $59,400 | $17,040 | $42,360 |
| 2024 | $6,992 | $56,640 | $17,040 | $39,600 |
| 2023 | $6,670 | $56,160 | $17,040 | $39,120 |
| 2022 | $6,557 | $51,960 | $17,040 | $34,920 |
| 2021 | $6,860 | $40,140 | $17,040 | $23,100 |
| 2020 | $3,217 | $47,100 | $17,040 | $30,060 |
| 2019 | $6,069 | $41,820 | $17,040 | $24,780 |
| 2018 | $5,579 | $27,370 | $13,589 | $13,781 |
| 2017 | $5,579 | $27,370 | $15,423 | $11,947 |
| 2016 | $5,430 | $27,163 | $13,678 | $13,485 |
| 2015 | $3,114 | $25,627 | $15,052 | $10,575 |
| 2014 | $3,114 | $24,177 | $14,524 | $9,653 |
Source: Public Records
Map
Nearby Homes