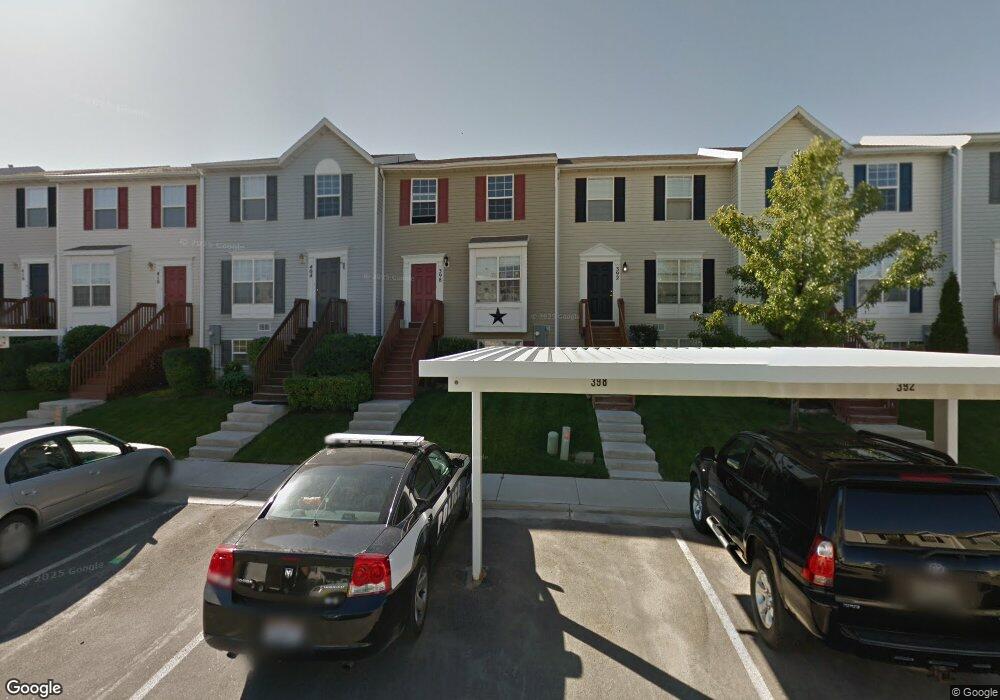
392 E 525 S Clearfield, UT 84015
Estimated Value: $288,000 - $321,000
2
Beds
1
Bath
1,131
Sq Ft
$270/Sq Ft
Est. Value
About This Home
This home is located at 392 E 525 S, Clearfield, UT 84015 and is currently estimated at $305,490, approximately $270 per square foot. 392 E 525 S is a home located in Davis County with nearby schools including South Clearfield Elementary School, North Davis Junior High School, and Clearfield High School.
Ownership History
Date
Name
Owned For
Owner Type
Purchase Details
Closed on
Jan 18, 2017
Sold by
Johnson Cindy Lee
Bought by
Johnson Cindy Lee and Pyles Jenna Lee
Current Estimated Value
Home Financials for this Owner
Home Financials are based on the most recent Mortgage that was taken out on this home.
Original Mortgage
$50,000
Outstanding Balance
$43,488
Interest Rate
4.3%
Mortgage Type
New Conventional
Estimated Equity
$262,002
Purchase Details
Closed on
Jan 14, 2000
Sold by
Johnson Joshua J
Bought by
Johnson Cindy Lee
Purchase Details
Closed on
Jul 30, 1999
Sold by
Newcastle Greene Llc
Bought by
Johnson Joshua J
Home Financials for this Owner
Home Financials are based on the most recent Mortgage that was taken out on this home.
Original Mortgage
$70,000
Interest Rate
7.64%
Create a Home Valuation Report for This Property
The Home Valuation Report is an in-depth analysis detailing your home's value as well as a comparison with similar homes in the area
Home Values in the Area
Average Home Value in this Area
Purchase History
| Date | Buyer | Sale Price | Title Company |
|---|---|---|---|
| Johnson Cindy Lee | -- | -- | |
| Johnson Cindy Lee | -- | -- | |
| Johnson Joshua J | -- | First American Title Ins Co |
Source: Public Records
Mortgage History
| Date | Status | Borrower | Loan Amount |
|---|---|---|---|
| Open | Johnson Cindy Lee | $50,000 | |
| Closed | Johnson Cindy Lee | $63,000 | |
| Closed | Johnson Joshua J | $70,000 | |
| Closed | Johnson Cindy Lee | $0 |
Source: Public Records
Tax History
| Year | Tax Paid | Tax Assessment Tax Assessment Total Assessment is a certain percentage of the fair market value that is determined by local assessors to be the total taxable value of land and additions on the property. | Land | Improvement |
|---|---|---|---|---|
| 2025 | $1,657 | $148,500 | $58,300 | $90,200 |
| 2024 | $1,615 | $145,750 | $45,650 | $100,100 |
| 2023 | $1,545 | $256,000 | $72,000 | $184,000 |
| 2022 | $1,602 | $143,550 | $36,300 | $107,250 |
| 2021 | $1,440 | $195,000 | $48,000 | $147,000 |
| 2020 | $1,279 | $172,000 | $31,000 | $141,000 |
| 2019 | $1,258 | $167,000 | $35,000 | $132,000 |
| 2018 | $1,160 | $150,000 | $30,000 | $120,000 |
| 2016 | $984 | $66,495 | $14,300 | $52,195 |
| 2015 | $928 | $59,840 | $14,300 | $45,540 |
| 2014 | $936 | $61,158 | $18,333 | $42,825 |
| 2013 | -- | $68,394 | $12,650 | $55,744 |
Source: Public Records
Map
Nearby Homes
- 417 E 500 S
- 434 E Depot St
- 549 S 450 E
- 458 E Depot St
- 462 E 625 S
- 421 E Penny Ln
- 833 S Cowans Ct
- 490 E 700 S Unit 524
- 490 E 700 S Unit C36
- 490 E 700 S Unit A2
- 490 E 700 S Unit D39
- 490 E 700 S Unit D42
- 490 E 700 S Unit D43
- 462 E London Way Unit 30
- 288 S 500 E Unit 1
- 875 S Depot St Unit C307
- 875 S Depot St Unit A335
- 875 S Depot St Unit C301
- 875 S Depot St Unit B355
- 875 S Depot St Unit A238
Your Personal Tour Guide
Ask me questions while you tour the home.