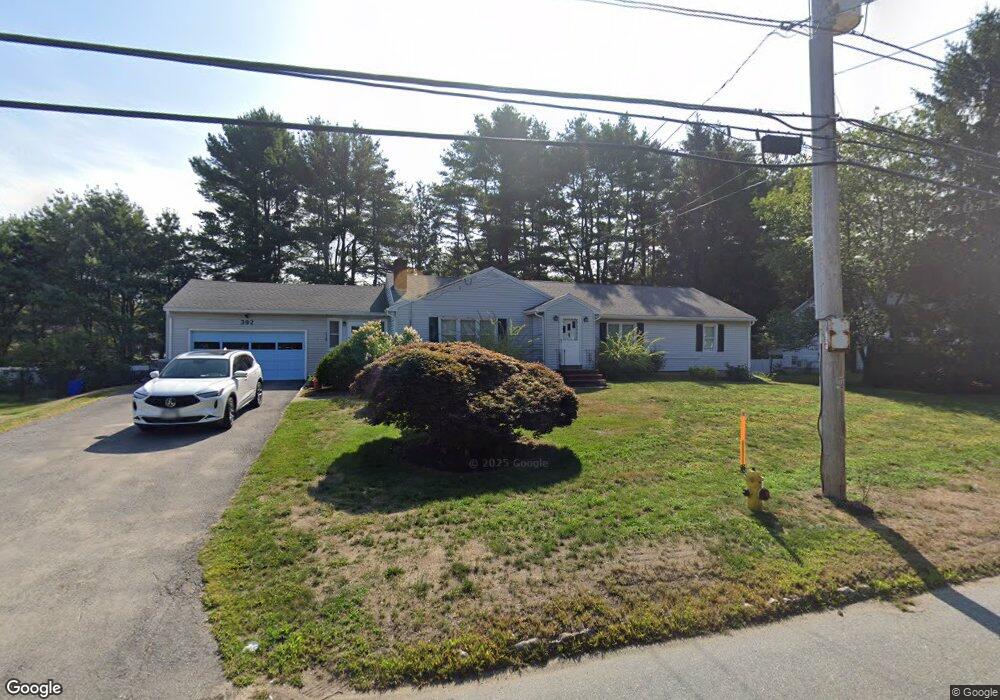
392 S Main St Andover, MA 01810
Estimated Value: $838,022 - $1,014,000
3
Beds
2
Baths
2,072
Sq Ft
$452/Sq Ft
Est. Value
About This Home
This home is located at 392 S Main St, Andover, MA 01810 and is currently estimated at $936,506, approximately $451 per square foot. 392 S Main St is a home located in Essex County with nearby schools including South Elementary School, Doherty Middle School, and Andover High School.
Ownership History
Date
Name
Owned For
Owner Type
Purchase Details
Closed on
Mar 5, 2022
Sold by
Iyer Alice and Iyer Vaidyanathan R
Bought by
Iyer Ft 2022 and Iyer
Current Estimated Value
Purchase Details
Closed on
May 21, 2007
Sold by
Iyer Alice
Bought by
Iyer Alice and Iyer Vaidyanathan R
Home Financials for this Owner
Home Financials are based on the most recent Mortgage that was taken out on this home.
Original Mortgage
$372,000
Interest Rate
6.18%
Mortgage Type
Purchase Money Mortgage
Purchase Details
Closed on
Sep 2, 1994
Sold by
Donovan Daniel J
Bought by
Iyer Alice
Purchase Details
Closed on
Dec 31, 1993
Sold by
Doikos Helen
Bought by
Donovan Daniel J
Create a Home Valuation Report for This Property
The Home Valuation Report is an in-depth analysis detailing your home's value as well as a comparison with similar homes in the area
Home Values in the Area
Average Home Value in this Area
Purchase History
| Date | Buyer | Sale Price | Title Company |
|---|---|---|---|
| Iyer Ft 2022 | -- | None Available | |
| Iyer Ft 2022 | -- | None Available | |
| Iyer Alice | -- | -- | |
| Iyer Alice | -- | -- | |
| Iyer Alice | -- | -- | |
| Iyer Alice | $205,000 | -- | |
| Iyer Alice | $205,000 | -- | |
| Donovan Daniel J | $185,000 | -- | |
| Donovan Daniel J | $185,000 | -- |
Source: Public Records
Mortgage History
| Date | Status | Borrower | Loan Amount |
|---|---|---|---|
| Previous Owner | Donovan Daniel J | $360,000 | |
| Previous Owner | Iyer Alice | $372,000 |
Source: Public Records
Tax History Compared to Growth
Tax History
| Year | Tax Paid | Tax Assessment Tax Assessment Total Assessment is a certain percentage of the fair market value that is determined by local assessors to be the total taxable value of land and additions on the property. | Land | Improvement |
|---|---|---|---|---|
| 2024 | $8,533 | $662,500 | $367,000 | $295,500 |
| 2023 | $8,279 | $606,100 | $339,700 | $266,400 |
| 2022 | $7,557 | $517,600 | $287,800 | $229,800 |
| 2021 | $7,226 | $472,600 | $261,600 | $211,000 |
| 2020 | $6,929 | $461,600 | $255,200 | $206,400 |
| 2019 | $6,853 | $448,800 | $247,800 | $201,000 |
| 2018 | $6,545 | $418,500 | $233,700 | $184,800 |
| 2017 | $6,259 | $412,300 | $229,100 | $183,200 |
| 2016 | $6,110 | $412,300 | $229,100 | $183,200 |
| 2015 | $5,882 | $392,900 | $220,200 | $172,700 |
Source: Public Records
Map
Nearby Homes
- 40 Ballardvale Rd
- 17 Linda Rd
- 18 Boston Rd
- 331 S Main St
- 56 Sunset Rock Rd
- 2 Clover Cir
- 3 West Hollow
- 11 Gould Rd
- 25 Timothy Dr
- 50 Hidden Rd
- 2 Tamys Ln
- 133B Salem
- 4 Hammond Way
- 31 Porter Rd
- 104 Salem St
- 40 Colonial Dr Unit 8
- 20 Colonial Dr Unit 3
- 8 Athena Cir
- 1 Colonial Dr Unit C1-6
- 1 Colonial Dr Unit B1-8