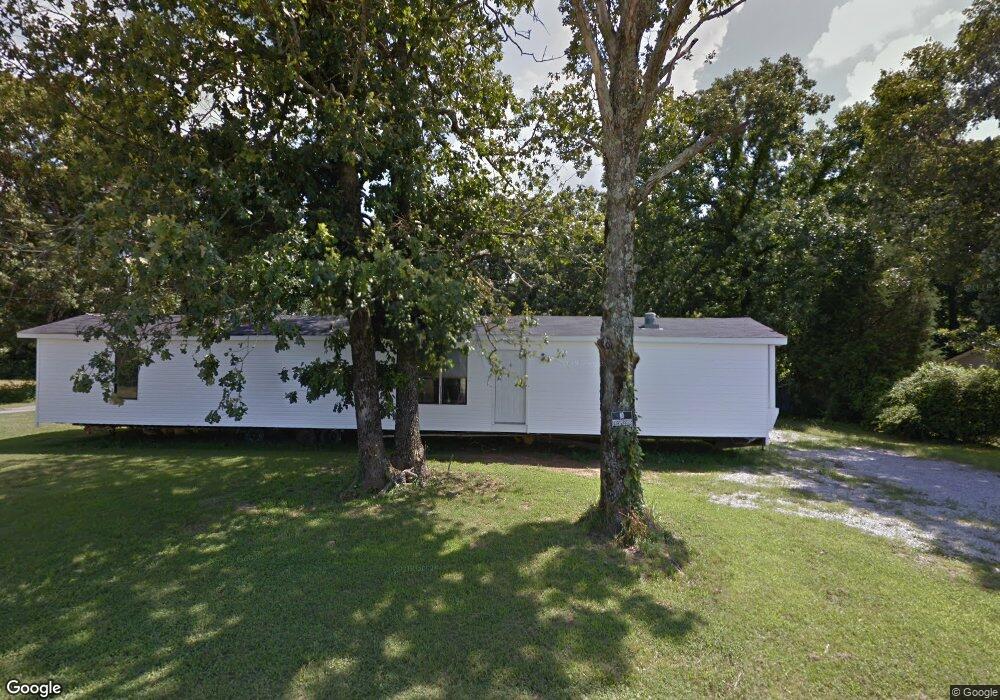
392 Stevenson Rd Ardmore, TN 38449
Estimated Value: $225,000 - $332,000
--
Bed
6
Baths
2,102
Sq Ft
$126/Sq Ft
Est. Value
About This Home
This home is located at 392 Stevenson Rd, Ardmore, TN 38449 and is currently estimated at $264,386, approximately $125 per square foot. 392 Stevenson Rd is a home located in Giles County with nearby schools including Elkton Elementary School and Giles County High School.
Ownership History
Date
Name
Owned For
Owner Type
Purchase Details
Closed on
Mar 19, 2024
Sold by
Higo Llc
Bought by
Villalpando Jorge and Villalpando Idla
Current Estimated Value
Home Financials for this Owner
Home Financials are based on the most recent Mortgage that was taken out on this home.
Original Mortgage
$49,000
Outstanding Balance
$48,160
Interest Rate
6.77%
Mortgage Type
Seller Take Back
Estimated Equity
$216,226
Purchase Details
Closed on
Sep 29, 2015
Sold by
Brantley Janice Olena
Bought by
Higo Llc
Purchase Details
Closed on
Feb 17, 2010
Sold by
Brantley Marion Estelle
Bought by
Brantley Kenneth D
Purchase Details
Closed on
Jun 18, 2003
Sold by
Brantley Alice E
Bought by
Brantley Kenneth D
Purchase Details
Closed on
Mar 6, 1990
Bought by
Brantley Elysee D and Brantley Alice E
Purchase Details
Closed on
May 11, 1988
Bought by
Mid-State Trust Ii
Purchase Details
Closed on
Aug 11, 1983
Bought by
Brantley Elysee D and Brantley Alice E
Purchase Details
Closed on
Feb 2, 1971
Create a Home Valuation Report for This Property
The Home Valuation Report is an in-depth analysis detailing your home's value as well as a comparison with similar homes in the area
Home Values in the Area
Average Home Value in this Area
Purchase History
| Date | Buyer | Sale Price | Title Company |
|---|---|---|---|
| Villalpando Jorge | $100,000 | None Listed On Document | |
| Higo Llc | $55,000 | -- | |
| Brantley Kenneth D | $20,000 | -- | |
| Brantley Kenneth D | $9,000 | -- | |
| Brantley Elysee D | -- | -- | |
| Mid-State Trust Ii | -- | -- | |
| Brantley Elysee D | -- | -- | |
| -- | -- | -- |
Source: Public Records
Mortgage History
| Date | Status | Borrower | Loan Amount |
|---|---|---|---|
| Open | Villalpando Jorge | $49,000 |
Source: Public Records
Tax History Compared to Growth
Tax History
| Year | Tax Paid | Tax Assessment Tax Assessment Total Assessment is a certain percentage of the fair market value that is determined by local assessors to be the total taxable value of land and additions on the property. | Land | Improvement |
|---|---|---|---|---|
| 2025 | $998 | $46,250 | $0 | $0 |
| 2024 | $998 | $46,500 | $7,450 | $39,050 |
| 2023 | $998 | $46,500 | $7,450 | $39,050 |
| 2022 | $998 | $46,500 | $7,450 | $39,050 |
| 2021 | $1,012 | $33,025 | $3,650 | $29,375 |
| 2020 | $1,012 | $33,025 | $3,650 | $29,375 |
| 2019 | $933 | $33,025 | $3,650 | $29,375 |
| 2018 | $1,011 | $33,025 | $3,650 | $29,375 |
| 2017 | $1,011 | $33,025 | $3,650 | $29,375 |
| 2016 | $1,393 | $43,375 | $2,725 | $40,650 |
| 2015 | $1,306 | $43,375 | $2,725 | $40,650 |
| 2014 | $1,306 | $43,372 | $0 | $0 |
Source: Public Records
Map
Nearby Homes
- 30A Stevenson Rd
- 30acres Stevenson Rd
- 30740 Mill Race Dr
- 26081 Pheasant Run
- 30679 Ardmore Ridge Rd
- 25230 Union Hill Rd
- 30518 Fort Hampton St
- 93 Merrill Rd
- 25668 Main St
- 30619 Highway 110
- 113 Elliot Rd
- 30176 Highway 110
- 2126 Ardmore Hwy
- 26210 Stateline Rd
- 167 Henry Bayless Rd
- 30065 Bankston Rd
- 26651 1st St
- 29847 1st Ave W
- 809 Lofton Hall Rd
- 239 Henry Bayless Rd
- 392 Stevenson Rd
- 368 Stevenson Rd
- 330 Stevenson Rd
- 316 Stevenson Rd
- 489 Stevenson Rd
- 314 Stevenson Rd
- 516 Stevenson Rd
- 31634 Ardmore Ridge Rd
- 312 Stevenson Rd
- 31502 Ardmore Ridge Rd
- 32000 Ardmore Ridge Rd
- 331 Stevenson Rd
- 171 Stevenson Rd
- 31935 Ardmore Ridge Rd
- 31965 Ardmore Ridge Rd
- 31995 Ardmore Ridge Rd
- 31312 Ardmore Ridge Rd
- 25987 Union Hill Rd
- 31266 Ardmore Ridge Rd
- 32015 Ardmore Ridge Rd