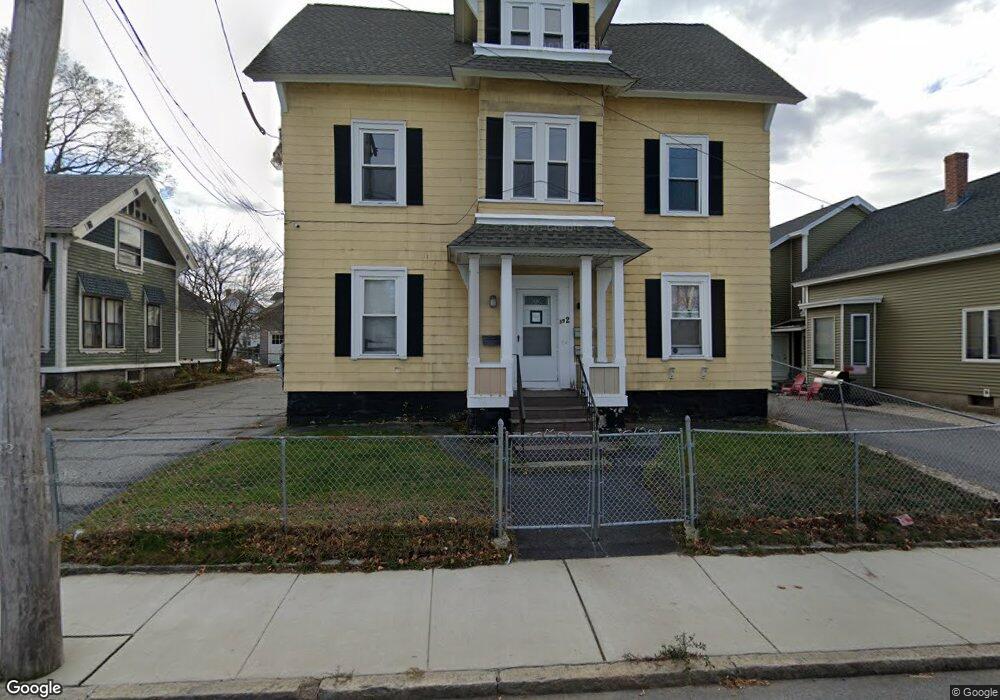
392 Westford St Lowell, MA 01851
Lower Highlands NeighborhoodEstimated Value: $834,000 - $911,000
9
Beds
3
Baths
4,855
Sq Ft
$178/Sq Ft
Est. Value
About This Home
This home is located at 392 Westford St, Lowell, MA 01851 and is currently estimated at $863,333, approximately $177 per square foot. 392 Westford St is a home located in Middlesex County with nearby schools including Charles W. Morey Elementary School, Abraham Lincoln Elementary School, and Dr. Gertrude Bailey Elementary School.
Ownership History
Date
Name
Owned For
Owner Type
Purchase Details
Closed on
Jun 23, 1995
Sold by
Bradley Vincent P
Bought by
Philakhong Noi and Philakhong Bouaravanh
Current Estimated Value
Home Financials for this Owner
Home Financials are based on the most recent Mortgage that was taken out on this home.
Original Mortgage
$116,590
Interest Rate
7.82%
Mortgage Type
Purchase Money Mortgage
Purchase Details
Closed on
Oct 7, 1993
Sold by
Jeanne Darc Cu
Bought by
Bardley Vincent P
Purchase Details
Closed on
May 14, 1993
Sold by
Belanger Doris L and Jeanne Darc Cu
Bought by
Jeanne Darc Cu
Create a Home Valuation Report for This Property
The Home Valuation Report is an in-depth analysis detailing your home's value as well as a comparison with similar homes in the area
Home Values in the Area
Average Home Value in this Area
Purchase History
| Date | Buyer | Sale Price | Title Company |
|---|---|---|---|
| Philakhong Noi | $117,900 | -- | |
| Philakhong Noi | $117,900 | -- | |
| Bardley Vincent P | $85,500 | -- | |
| Bardley Vincent P | $85,500 | -- | |
| Jeanne Darc Cu | $70,000 | -- | |
| Jeanne Darc Cu | $70,000 | -- |
Source: Public Records
Mortgage History
| Date | Status | Borrower | Loan Amount |
|---|---|---|---|
| Open | Jeanne Darc Cu | $170,000 | |
| Closed | Jeanne Darc Cu | $116,590 |
Source: Public Records
Tax History Compared to Growth
Tax History
| Year | Tax Paid | Tax Assessment Tax Assessment Total Assessment is a certain percentage of the fair market value that is determined by local assessors to be the total taxable value of land and additions on the property. | Land | Improvement |
|---|---|---|---|---|
| 2025 | $9,748 | $849,100 | $176,400 | $672,700 |
| 2024 | $9,224 | $774,500 | $158,700 | $615,800 |
| 2023 | $9,027 | $726,800 | $138,000 | $588,800 |
| 2022 | $8,380 | $660,400 | $125,500 | $534,900 |
| 2021 | $7,258 | $539,200 | $109,200 | $430,000 |
| 2020 | $6,500 | $486,500 | $95,400 | $391,100 |
| 2019 | $6,311 | $449,500 | $88,400 | $361,100 |
| 2018 | $5,707 | $396,600 | $80,400 | $316,200 |
| 2017 | $5,406 | $362,300 | $73,100 | $289,200 |
| 2016 | $4,841 | $319,300 | $69,600 | $249,700 |
| 2015 | $4,616 | $298,200 | $71,300 | $226,900 |
| 2013 | $4,089 | $272,400 | $85,200 | $187,200 |
Source: Public Records
Map
Nearby Homes