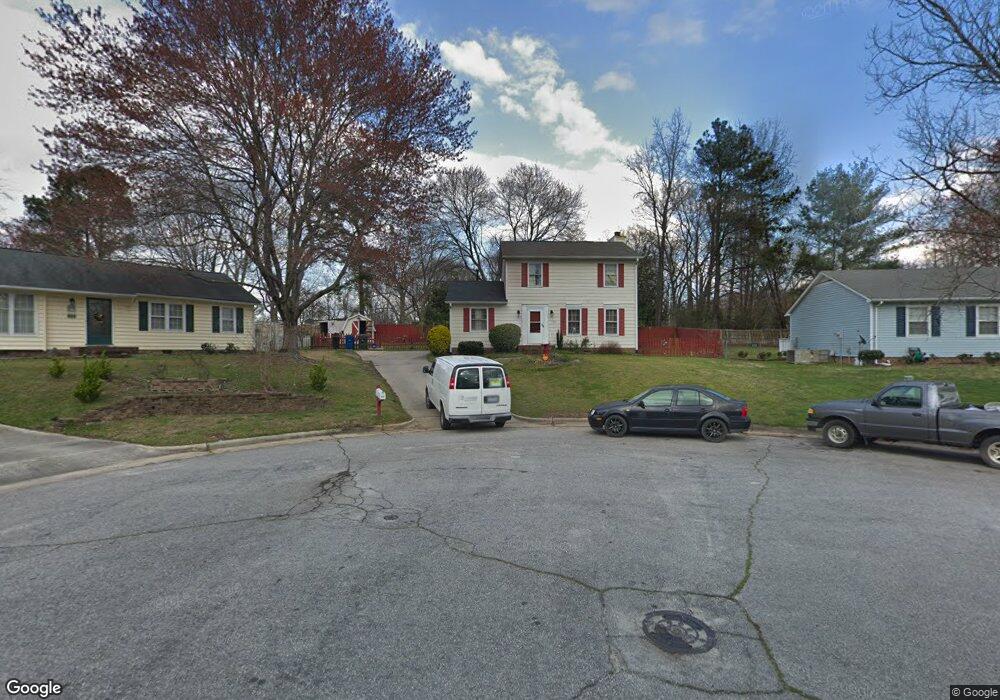
3920 Summer Place Raleigh, NC 27604
Northeast Raleigh NeighborhoodEstimated Value: $295,000 - $353,000
3
Beds
2
Baths
1,600
Sq Ft
$202/Sq Ft
Est. Value
About This Home
This home is located at 3920 Summer Place, Raleigh, NC 27604 and is currently estimated at $323,681, approximately $202 per square foot. 3920 Summer Place is a home located in Wake County with nearby schools including Wilburn Elementary, Durant Road Middle, and Heritage High School.
Ownership History
Date
Name
Owned For
Owner Type
Purchase Details
Closed on
Jun 13, 2014
Sold by
Wilcox Robert J and Wilcox Shannon
Bought by
Ferreira Altagracia
Current Estimated Value
Home Financials for this Owner
Home Financials are based on the most recent Mortgage that was taken out on this home.
Original Mortgage
$122,735
Outstanding Balance
$93,530
Interest Rate
4.25%
Mortgage Type
FHA
Estimated Equity
$230,151
Purchase Details
Closed on
Nov 18, 2005
Sold by
Reynoso Virna L
Bought by
Wilcox Robert J and Villers Shannon
Home Financials for this Owner
Home Financials are based on the most recent Mortgage that was taken out on this home.
Original Mortgage
$104,037
Interest Rate
5.9%
Mortgage Type
FHA
Purchase Details
Closed on
Apr 15, 1999
Sold by
Keplar Kenneth W
Bought by
Reynoso Virna L
Home Financials for this Owner
Home Financials are based on the most recent Mortgage that was taken out on this home.
Original Mortgage
$113,934
Interest Rate
7.08%
Mortgage Type
VA
Create a Home Valuation Report for This Property
The Home Valuation Report is an in-depth analysis detailing your home's value as well as a comparison with similar homes in the area
Home Values in the Area
Average Home Value in this Area
Purchase History
| Date | Buyer | Sale Price | Title Company |
|---|---|---|---|
| Ferreira Altagracia | $125,000 | None Available | |
| Wilcox Robert J | $123,000 | None Available | |
| Reynoso Virna L | $112,000 | -- |
Source: Public Records
Mortgage History
| Date | Status | Borrower | Loan Amount |
|---|---|---|---|
| Open | Ferreira Altagracia | $122,735 | |
| Previous Owner | Wilcox Robert J | $104,037 | |
| Previous Owner | Wilcox Robert J | $20,000 | |
| Previous Owner | Reynoso Virna L | $113,934 |
Source: Public Records
Tax History Compared to Growth
Tax History
| Year | Tax Paid | Tax Assessment Tax Assessment Total Assessment is a certain percentage of the fair market value that is determined by local assessors to be the total taxable value of land and additions on the property. | Land | Improvement |
|---|---|---|---|---|
| 2025 | $2,382 | $296,328 | $95,000 | $201,328 |
| 2024 | $2,372 | $270,837 | $95,000 | $175,837 |
| 2023 | $1,751 | $158,850 | $40,000 | $118,850 |
| 2022 | $1,628 | $158,850 | $40,000 | $118,850 |
| 2021 | $1,566 | $158,850 | $40,000 | $118,850 |
| 2020 | $1,537 | $158,850 | $40,000 | $118,850 |
| 2019 | $1,498 | $127,546 | $34,000 | $93,546 |
| 2018 | $1,414 | $127,546 | $34,000 | $93,546 |
| 2017 | $1,347 | $127,546 | $34,000 | $93,546 |
| 2016 | $1,319 | $127,546 | $34,000 | $93,546 |
| 2015 | $1,352 | $128,614 | $38,000 | $90,614 |
| 2014 | $1,283 | $128,614 | $38,000 | $90,614 |
Source: Public Records
Map
Nearby Homes
- 3912 Summer Place
- 3607 Buffaloe Rd
- 3735 Bison Hill Ln
- 4106 N New Hope Rd
- 4200 James
- 3749 Bison Hill Ln
- 3936 Iron Horse Rd
- 3635 Water Mist Ln
- 3636 Water Mist Ln
- 3721 Baugh St
- 3605 Satellite Ct
- 4208 Reddington Trail
- 4217 James Rd
- 4317 Woodlawn Dr
- 3622 Top of the Pines Ct
- 3614 Top of the Pines Ct
- 4522 Centrebrook Cir
- 4443 Antique Ln Unit D1
- 4508 Centrebrook Cir
- 4236 Lake Ridge Dr Unit 11B
- 3924 Summer Place
- 3916 Summer Place
- 3917 Howard Cir
- 3813 Summer Place
- 3913 Howard Cir
- 3917 Summer Place
- 3809 Summer Place
- 3920 Howard Cir
- 3814 Lee Rd
- 3908 Summer Place
- 3816 Lee Rd
- 3810 Lee Rd
- 3913 Summer Place
- 3927 Summer Place
- 3909 Howard Cir
- 3805 Summer Place
- 3820 Lee Rd
- 3920 Westra Dr
- 3806 Lee Rd
- 3904 Summer Place