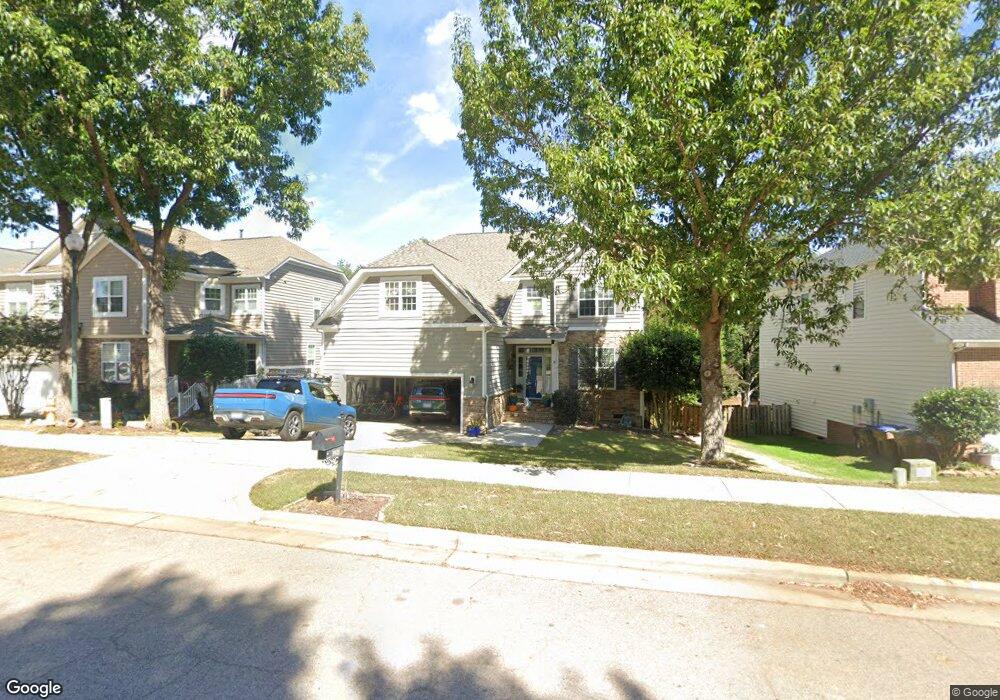
3921 Song Sparrow Dr Wake Forest, NC 27587
Estimated Value: $571,000 - $620,908
5
Beds
3
Baths
3,085
Sq Ft
$191/Sq Ft
Est. Value
About This Home
This home is located at 3921 Song Sparrow Dr, Wake Forest, NC 27587 and is currently estimated at $589,477, approximately $191 per square foot. 3921 Song Sparrow Dr is a home located in Wake County with nearby schools including Rolesville Elementary School, Wake Forest-Rolesville Middle School, and Heritage High School.
Ownership History
Date
Name
Owned For
Owner Type
Purchase Details
Closed on
Jan 8, 2008
Sold by
Green Amos A and Pridgen Kay
Bought by
Wells Stephanie Elaine and Van Wells Eric
Current Estimated Value
Home Financials for this Owner
Home Financials are based on the most recent Mortgage that was taken out on this home.
Original Mortgage
$254,125
Interest Rate
5.63%
Mortgage Type
Purchase Money Mortgage
Purchase Details
Closed on
Jul 10, 2006
Sold by
Lennar Carolinas Llc
Bought by
Green Amos A and Pridgen Kay
Home Financials for this Owner
Home Financials are based on the most recent Mortgage that was taken out on this home.
Original Mortgage
$257,000
Interest Rate
5.75%
Mortgage Type
Purchase Money Mortgage
Create a Home Valuation Report for This Property
The Home Valuation Report is an in-depth analysis detailing your home's value as well as a comparison with similar homes in the area
Home Values in the Area
Average Home Value in this Area
Purchase History
| Date | Buyer | Sale Price | Title Company |
|---|---|---|---|
| Wells Stephanie Elaine | $267,500 | None Available | |
| Green Amos A | $290,000 | None Available |
Source: Public Records
Mortgage History
| Date | Status | Borrower | Loan Amount |
|---|---|---|---|
| Previous Owner | Wells Stephanie Elaine | $254,125 | |
| Previous Owner | Green Amos A | $257,000 |
Source: Public Records
Tax History Compared to Growth
Tax History
| Year | Tax Paid | Tax Assessment Tax Assessment Total Assessment is a certain percentage of the fair market value that is determined by local assessors to be the total taxable value of land and additions on the property. | Land | Improvement |
|---|---|---|---|---|
| 2025 | $5,434 | $569,592 | $100,000 | $469,592 |
| 2024 | $5,413 | $564,802 | $100,000 | $464,802 |
| 2023 | $4,210 | $360,559 | $50,000 | $310,559 |
| 2022 | $4,038 | $360,559 | $50,000 | $310,559 |
| 2021 | $3,968 | $360,559 | $50,000 | $310,559 |
| 2020 | $3,968 | $360,559 | $50,000 | $310,559 |
| 2019 | $3,993 | $320,212 | $48,000 | $272,212 |
| 2018 | $3,781 | $320,212 | $48,000 | $272,212 |
| 2017 | $3,654 | $320,212 | $48,000 | $272,212 |
| 2016 | $3,608 | $320,212 | $48,000 | $272,212 |
| 2015 | $3,996 | $307,754 | $57,000 | $250,754 |
| 2014 | $3,399 | $307,754 | $57,000 | $250,754 |
Source: Public Records
Map
Nearby Homes
- 3905 Song Sparrow Dr
- 3921 Robins Nest Ln
- 709 Marshall Farm St
- 9117 Linslade Way
- 6633 Penfield St
- 749 Marshall Farm St
- 1413 Yardley Dr
- 1317 Mackinaw Dr
- 1212 Mackinaw Dr
- 713 Brownwich St
- 9528 White Carriage Dr
- 2944 Carriage Meadows Dr
- 3432 Mountain Hill Dr
- 3807 Heritage Spring Cir
- 3819 Wild Meadow Ln
- 3830 Heritage View Trail
- 1101 Willowgrass Ln Unit 15A
- 1201 Argentum St
- 916 Overlook Ridge Rd
- 1122 Willowgrass Ln
- 3917 Song Sparrow Dr
- 3925 Song Sparrow Dr
- 3913 Song Sparrow Dr
- 3929 Song Sparrow Dr
- 3916 Song Sparrow Dr
- 3912 Song Sparrow Dr
- 3933 Song Sparrow Dr
- 3920 Song Sparrow Dr
- 3908 Song Sparrow Dr
- 3924 Song Sparrow Dr
- 3904 Song Sparrow Dr
- 3928 Song Sparrow Dr
- 4001 Song Sparrow Dr
- 3932 Song Sparrow Dr
- 3909 Robins Nest Ln
- 3900 Song Sparrow Dr
- 3913 Robins Nest Ln
- 3905 Robins Nest Ln
- 4005 Song Sparrow Dr
- 3917 Robins Nest Ln