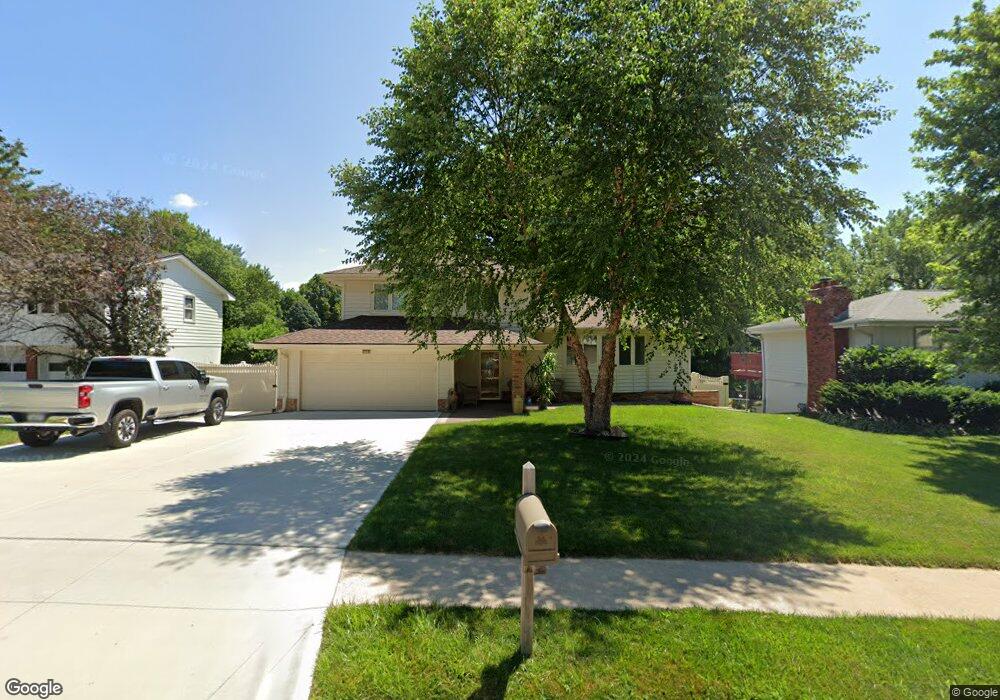
3923 N 94th St Omaha, NE 68134
Maple Village NeighborhoodEstimated Value: $279,000 - $307,000
3
Beds
5
Baths
1,612
Sq Ft
$182/Sq Ft
Est. Value
About This Home
This home is located at 3923 N 94th St, Omaha, NE 68134 and is currently estimated at $293,019, approximately $181 per square foot. 3923 N 94th St is a home located in Douglas County with nearby schools including Dodge Elementary School, Morton Magnet Middle School, and Burke High School.
Ownership History
Date
Name
Owned For
Owner Type
Purchase Details
Closed on
Oct 2, 2001
Sold by
Norwest Bank Minnesota National Assn
Bought by
Carter Robin S and Carter Cynthia L
Current Estimated Value
Home Financials for this Owner
Home Financials are based on the most recent Mortgage that was taken out on this home.
Original Mortgage
$97,000
Outstanding Balance
$37,942
Interest Rate
6.88%
Estimated Equity
$255,077
Purchase Details
Closed on
Jun 12, 2001
Sold by
Madsen Thomas M and Madsen Carol S
Bought by
Norwest Bank Minnesota National Assn
Create a Home Valuation Report for This Property
The Home Valuation Report is an in-depth analysis detailing your home's value as well as a comparison with similar homes in the area
Home Values in the Area
Average Home Value in this Area
Purchase History
| Date | Buyer | Sale Price | Title Company |
|---|---|---|---|
| Carter Robin S | $96,428 | -- | |
| Norwest Bank Minnesota National Assn | $98,400 | -- |
Source: Public Records
Mortgage History
| Date | Status | Borrower | Loan Amount |
|---|---|---|---|
| Open | Carter Robin S | $97,000 |
Source: Public Records
Tax History Compared to Growth
Tax History
| Year | Tax Paid | Tax Assessment Tax Assessment Total Assessment is a certain percentage of the fair market value that is determined by local assessors to be the total taxable value of land and additions on the property. | Land | Improvement |
|---|---|---|---|---|
| 2024 | $5,682 | $269,300 | $20,900 | $248,400 |
| 2023 | $5,682 | $269,300 | $20,900 | $248,400 |
| 2022 | $4,737 | $221,900 | $20,900 | $201,000 |
| 2021 | $4,697 | $221,900 | $20,900 | $201,000 |
| 2020 | $3,749 | $175,100 | $20,900 | $154,200 |
| 2019 | $3,760 | $175,100 | $20,900 | $154,200 |
| 2018 | $3,161 | $147,000 | $20,900 | $126,100 |
| 2017 | $3,019 | $139,700 | $43,800 | $95,900 |
| 2016 | $3,094 | $144,200 | $21,400 | $122,800 |
| 2015 | $2,854 | $134,800 | $20,000 | $114,800 |
| 2014 | $2,854 | $134,800 | $20,000 | $114,800 |
Source: Public Records
Map
Nearby Homes
- 3914 N 94th St
- 3937 N 95th St
- 9216 Sprague St
- 4211 N 94th St
- 9430 Taylor St
- 9447 Ames Ave
- 9150 Boyd St
- 3854 Parkview Dr
- 9508 Emmet St
- 9512 Emmet St
- 3906 N 97th St
- OMLB Tbd Dr
- 9616 Meredith Ave
- 3216 Cottonwood Ln
- 9149 Fowler Ave
- 4705 N 96th St
- 9482 Spencer St
- 9823 Ruggles St
- 3404 Terrace Dr
- 9442 Fowler Ave