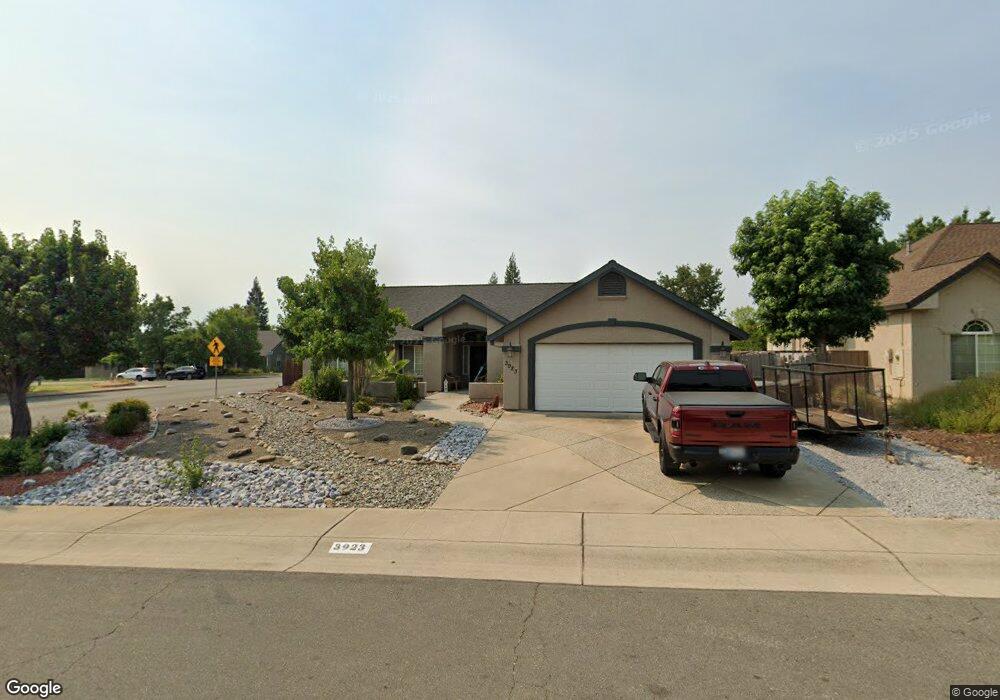
3923 Whitney Ct Redding, CA 96001
Ridgeview NeighborhoodEstimated Value: $463,125 - $476,000
3
Beds
2
Baths
1,900
Sq Ft
$247/Sq Ft
Est. Value
About This Home
This home is located at 3923 Whitney Ct, Redding, CA 96001 and is currently estimated at $469,531, approximately $247 per square foot. 3923 Whitney Ct is a home located in Shasta County with nearby schools including Manzanita Elementary School, Sequoia Middle School, and Shasta High School.
Ownership History
Date
Name
Owned For
Owner Type
Purchase Details
Closed on
Jul 14, 2014
Sold by
Mullens Larry W
Bought by
Mullens Larry W
Current Estimated Value
Purchase Details
Closed on
Aug 5, 2002
Sold by
Hulett Dean R
Bought by
Mullens Larry W and Mullens Sandra L
Home Financials for this Owner
Home Financials are based on the most recent Mortgage that was taken out on this home.
Original Mortgage
$174,400
Outstanding Balance
$73,586
Interest Rate
6.51%
Estimated Equity
$395,945
Purchase Details
Closed on
Jul 31, 2002
Sold by
Hulett Dean R and Goodman Diane
Bought by
Hulett Dean R
Home Financials for this Owner
Home Financials are based on the most recent Mortgage that was taken out on this home.
Original Mortgage
$174,400
Outstanding Balance
$73,586
Interest Rate
6.51%
Estimated Equity
$395,945
Purchase Details
Closed on
Sep 25, 1997
Sold by
Hulett Dean R and Hulett Diane
Bought by
Hulett Dean R and Hulett Diane
Create a Home Valuation Report for This Property
The Home Valuation Report is an in-depth analysis detailing your home's value as well as a comparison with similar homes in the area
Home Values in the Area
Average Home Value in this Area
Purchase History
| Date | Buyer | Sale Price | Title Company |
|---|---|---|---|
| Mullens Larry W | -- | None Available | |
| Mullens Larry W | $218,000 | First American Title Co | |
| Hulett Dean R | -- | First American Title Co | |
| Hulett Dean R | -- | -- |
Source: Public Records
Mortgage History
| Date | Status | Borrower | Loan Amount |
|---|---|---|---|
| Open | Mullens Larry W | $174,400 |
Source: Public Records
Tax History
| Year | Tax Paid | Tax Assessment Tax Assessment Total Assessment is a certain percentage of the fair market value that is determined by local assessors to be the total taxable value of land and additions on the property. | Land | Improvement |
|---|---|---|---|---|
| 2025 | $3,549 | $341,305 | $57,921 | $283,384 |
| 2024 | $3,493 | $334,614 | $56,786 | $277,828 |
| 2023 | $3,493 | $328,054 | $55,673 | $272,381 |
| 2022 | $3,433 | $321,623 | $54,582 | $267,041 |
| 2021 | $3,409 | $315,317 | $53,512 | $261,805 |
| 2020 | $3,450 | $312,085 | $52,964 | $259,121 |
| 2019 | $3,277 | $305,967 | $51,926 | $254,041 |
| 2018 | $3,303 | $299,968 | $50,908 | $249,060 |
| 2017 | $3,282 | $294,087 | $49,910 | $244,177 |
| 2016 | $3,178 | $288,322 | $48,932 | $239,390 |
| 2015 | $3,103 | $283,992 | $48,197 | $235,795 |
| 2014 | $2,908 | $260,000 | $50,000 | $210,000 |
Source: Public Records
Map
Nearby Homes
- 4065 Meander Dr
- 4125 Oro St
- 3882 Fujiyama Way
- 2242 Everest Dr
- 1783 Record Ln
- 4160 Travona Ct
- 2358 Cumberland Dr
- 1846 Kildare Dr
- 1974 Kildare Dr
- 1854 Mary Lake Dr
- 1695 Kildare Dr
- 2135 Adirondack Dr
- 1692 Kildare Dr
- 1756 Mary Lake Dr
- 4519 Nantucket Dr
- 4268 Boston Ave
- 4478 Moyvane Dr
- 16928 Campo Calle
- 3701 Cal Ore Dr
- 3380 Placer St
- 3945 Whitney Ct
- The Whitney Ct
- 0 Whitney Ct
- 3894 Appalachian Way
- 3967 Whitney Ct
- 3897 Appalachian Way Unit SFR
- 3912 Whitney Ct
- 3882 Appalachian Way
- 3891 Rushmore Dr
- 3934 Whitney Ct
- 3989 Whitney Ct
- 3885 Appalachian Way
- 3956 Whitney Ct
- 3885 Rushmore Dr
- 2125 Cumberland Dr
- 3870 Appalachian Way
- 3978 Whitney Ct
- 2011 Winchester Place
- 3873 Appalachian Way
- 3867 Rushmore Dr
Your Personal Tour Guide
Ask me questions while you tour the home.