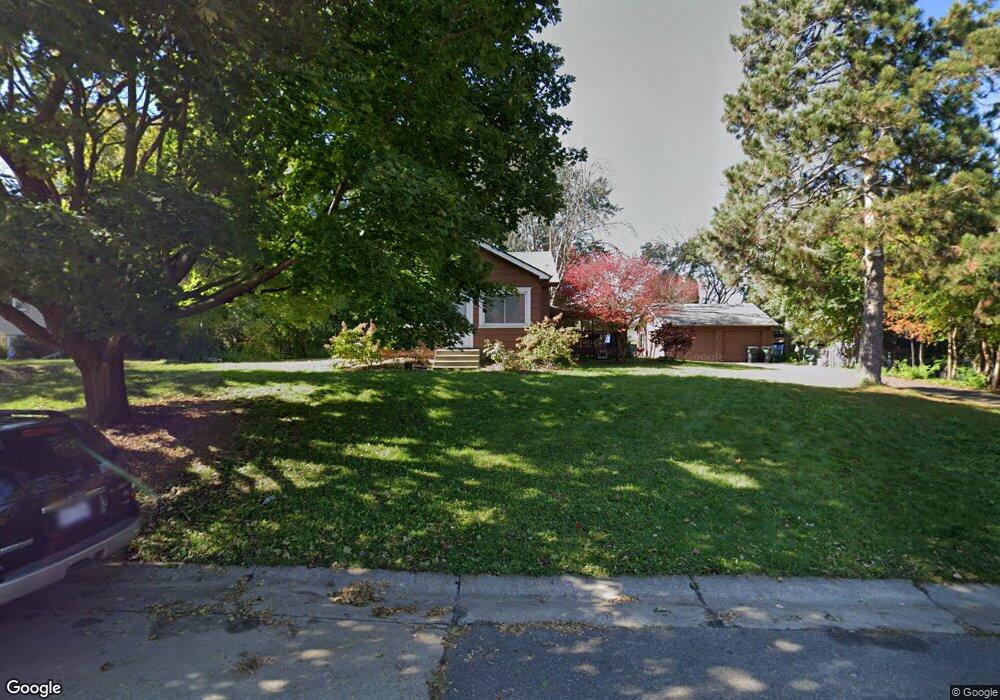
3924 3924 MacAlaster Dr NE St. Anthony, MN 55421
Estimated Value: $256,000 - $284,000
2
Beds
1
Bath
997
Sq Ft
$273/Sq Ft
Est. Value
About This Home
This home is located at 3924 3924 MacAlaster Dr NE, St. Anthony, MN 55421 and is currently estimated at $272,639, approximately $273 per square foot. 3924 3924 MacAlaster Dr NE is a home located in Ramsey County with nearby schools including Wilshire Park Elementary School, Highland Elementary School, and St. Anthony Middle School.
Ownership History
Date
Name
Owned For
Owner Type
Purchase Details
Closed on
Nov 30, 2022
Sold by
Gretchen M Dahlberg Intervivos Revocable
Bought by
Riera Imelda and Sinchi David
Current Estimated Value
Home Financials for this Owner
Home Financials are based on the most recent Mortgage that was taken out on this home.
Original Mortgage
$189,000
Interest Rate
6.49%
Mortgage Type
New Conventional
Purchase Details
Closed on
Feb 1, 2016
Sold by
Dehlberg Gretchen M
Bought by
Dahlberg Gretchen M and Gretchen M Dahlberg Revocable Trust
Purchase Details
Closed on
Jun 13, 2014
Sold by
Tagapan James E and Tagapan Sheila O
Bought by
Sandbo Hans K
Purchase Details
Closed on
Mar 7, 2008
Sold by
Fv-I Inc
Bought by
Tagapan James E and Tagapan Sheila O
Purchase Details
Closed on
Apr 29, 1997
Sold by
Mull Rita and Tyrrell Louise
Bought by
Condon Mary and Stevens Lynda
Create a Home Valuation Report for This Property
The Home Valuation Report is an in-depth analysis detailing your home's value as well as a comparison with similar homes in the area
Home Values in the Area
Average Home Value in this Area
Purchase History
| Date | Buyer | Sale Price | Title Company |
|---|---|---|---|
| Riera Imelda | $252,000 | -- | |
| Dahlberg Gretchen M | -- | None Available | |
| Sandbo Hans K | $139,090 | Burnet Title | |
| Tagapan James E | $155,000 | -- | |
| Condon Mary | $92,900 | -- |
Source: Public Records
Mortgage History
| Date | Status | Borrower | Loan Amount |
|---|---|---|---|
| Previous Owner | Riera Imelda | $189,000 |
Source: Public Records
Tax History Compared to Growth
Tax History
| Year | Tax Paid | Tax Assessment Tax Assessment Total Assessment is a certain percentage of the fair market value that is determined by local assessors to be the total taxable value of land and additions on the property. | Land | Improvement |
|---|---|---|---|---|
| 2025 | $4,620 | $265,100 | $80,000 | $185,100 |
| 2023 | $4,620 | $263,300 | $80,000 | $183,300 |
| 2022 | $3,690 | $245,700 | $80,000 | $165,700 |
| 2021 | $3,640 | $223,600 | $80,000 | $143,600 |
| 2020 | $4,786 | $222,700 | $78,100 | $144,600 |
| 2019 | $3,180 | $222,700 | $78,100 | $144,600 |
| 2018 | $2,896 | $183,500 | $78,100 | $105,400 |
| 2017 | $2,720 | $166,800 | $78,100 | $88,700 |
| 2016 | $2,554 | $0 | $0 | $0 |
| 2015 | $2,308 | $149,100 | $68,300 | $80,800 |
| 2014 | $3,180 | $0 | $0 | $0 |
Source: Public Records
Map
Nearby Homes
- 2916 Silver Lake Ct NE
- 3808 Foss Rd Unit 2
- 4074 Foss Rd
- 4004 Foss Rd Unit 101
- 3912 Foss Rd Unit 206
- 4078 Foss Rd
- 155 Windsor Ln
- 2405 39th Ave NE Unit 307
- 2540 38th Ave NE Unit 217
- 2550 38th Ave NE Unit 112
- 2550 38th Ave NE Unit 208
- 3004 36th Ave NE
- 228 16th Ave SW
- 3532 Belden Dr NE
- 91 19th Ave SW
- 20 Windsor Ln Unit 111A
- 519 Continental Dr
- 10 Windsor Ct Unit 102
- 544 Riviera Dr
- 3960 Mckinley St NE
- 3924 3924 MacAlaster-drive-ne
- 3924 MacAlaster Dr NE
- 3926 MacAlaster Dr NE
- 3920 MacAlaster Dr NE
- 3916 3916 MacAlaster-drive-ne
- 3936 MacAlaster Dr NE
- 3916 MacAlaster Dr NE
- 3917 MacAlaster Dr NE
- 3925 Penrod Ln
- 3929 Penrod Ln
- 3921 Penrod Ln
- 3912 3912 MacAlaster-drive-ne
- 3912 3912 MacAlaster Dr NE
- 4001 Penrod Ln
- 4000 MacAlaster Dr NE
- 3912 MacAlaster Dr NE
- 3913 MacAlaster Dr NE
- 3917 Penrod Ln
- 3916 Shamrock Dr NE
- 4005 Penrod Ln