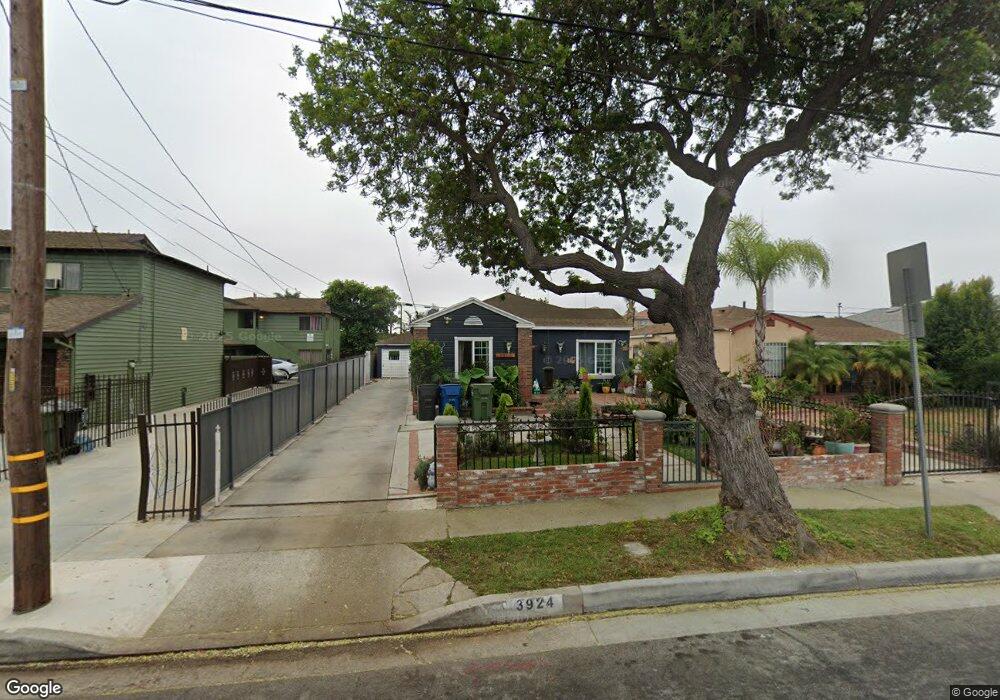
3924 W 112th St Inglewood, CA 90303
South Inglewood NeighborhoodEstimated Value: $725,978 - $768,000
3
Beds
1
Bath
1,118
Sq Ft
$668/Sq Ft
Est. Value
About This Home
This home is located at 3924 W 112th St, Inglewood, CA 90303 and is currently estimated at $746,495, approximately $667 per square foot. 3924 W 112th St is a home located in Los Angeles County with nearby schools including Bennett/Kew Elementary School, Monroe (Albert F.) Middle School, and Morningside High School.
Ownership History
Date
Name
Owned For
Owner Type
Purchase Details
Closed on
Sep 26, 2003
Sold by
Gutierrez Jose
Bought by
Garcia Jesus Antonio Romero and Deromero Mara Alicia Lopez
Current Estimated Value
Home Financials for this Owner
Home Financials are based on the most recent Mortgage that was taken out on this home.
Original Mortgage
$234,000
Outstanding Balance
$107,472
Interest Rate
5.98%
Mortgage Type
Purchase Money Mortgage
Estimated Equity
$639,023
Purchase Details
Closed on
Jun 27, 2001
Sold by
Lopez Melquides
Bought by
Gutierrez Jose and Gutierrez Angelica
Home Financials for this Owner
Home Financials are based on the most recent Mortgage that was taken out on this home.
Original Mortgage
$180,172
Interest Rate
7.05%
Mortgage Type
FHA
Purchase Details
Closed on
Dec 22, 1998
Sold by
Ocampo Victoriano
Bought by
Lopez Melquiades and Lopez Maria
Create a Home Valuation Report for This Property
The Home Valuation Report is an in-depth analysis detailing your home's value as well as a comparison with similar homes in the area
Home Values in the Area
Average Home Value in this Area
Purchase History
| Date | Buyer | Sale Price | Title Company |
|---|---|---|---|
| Garcia Jesus Antonio Romero | $260,000 | Commerce Title | |
| Gutierrez Jose | $183,000 | North American Title Co | |
| Lopez Melquiades | -- | American Title |
Source: Public Records
Mortgage History
| Date | Status | Borrower | Loan Amount |
|---|---|---|---|
| Open | Garcia Jesus Antonio Romero | $234,000 | |
| Previous Owner | Gutierrez Jose | $180,172 | |
| Closed | Garcia Jesus Antonio Romero | $13,000 |
Source: Public Records
Tax History Compared to Growth
Tax History
| Year | Tax Paid | Tax Assessment Tax Assessment Total Assessment is a certain percentage of the fair market value that is determined by local assessors to be the total taxable value of land and additions on the property. | Land | Improvement |
|---|---|---|---|---|
| 2025 | $4,889 | $369,646 | $295,724 | $73,922 |
| 2024 | $4,889 | $362,399 | $289,926 | $72,473 |
| 2023 | $4,839 | $355,294 | $284,242 | $71,052 |
| 2022 | $4,925 | $348,328 | $278,669 | $69,659 |
| 2021 | $4,878 | $341,499 | $273,205 | $68,294 |
| 2019 | $4,588 | $331,371 | $265,102 | $66,269 |
| 2018 | $4,520 | $324,874 | $259,904 | $64,970 |
| 2016 | $4,280 | $312,261 | $249,812 | $62,449 |
| 2015 | $4,241 | $307,571 | $246,060 | $61,511 |
| 2014 | $4,237 | $301,548 | $241,241 | $60,307 |
Source: Public Records
Map
Nearby Homes
- 3848 W 112th St
- 4115 W 111th St
- 4136 W 111th St
- 3743 W 112th St
- 10914 S Osage Ave
- 3871 W 109th St Unit 1
- 11121 S Freeman Ave
- 3856 W 108th St
- 3713 W Imperial Hwy
- 4144 Lennox Blvd
- 3668 W 109th St
- 11319 Larch Ave
- 10701 Doty Ave
- 3934 W 106th St
- 3803 W 107th St
- 3830 W 118th St
- 11825 Menlo Ave
- 3918 W 118th Place Unit 8
- 3751 W 106th St
- 3724 W 105th St
- 3928 W 112th St
- 3916 W 112th St
- 3932 W 112th St
- 3936 W 112th St
- 3923 W 113th St
- 3919 W 113th St
- 3906 W 112th St
- 3931 W 113th St
- 3915 W 113th St
- 3913 W 113th St
- 3935 W 113th St
- 3923 W 112th St
- 3921 W 112th St
- 3931 W 112th St
- 3917 W 112th St
- 3904 W 112th St
- 3939 W 113th St
- 3905 W 113th St
- 3911 W 112th St
- 3935 W 112th St