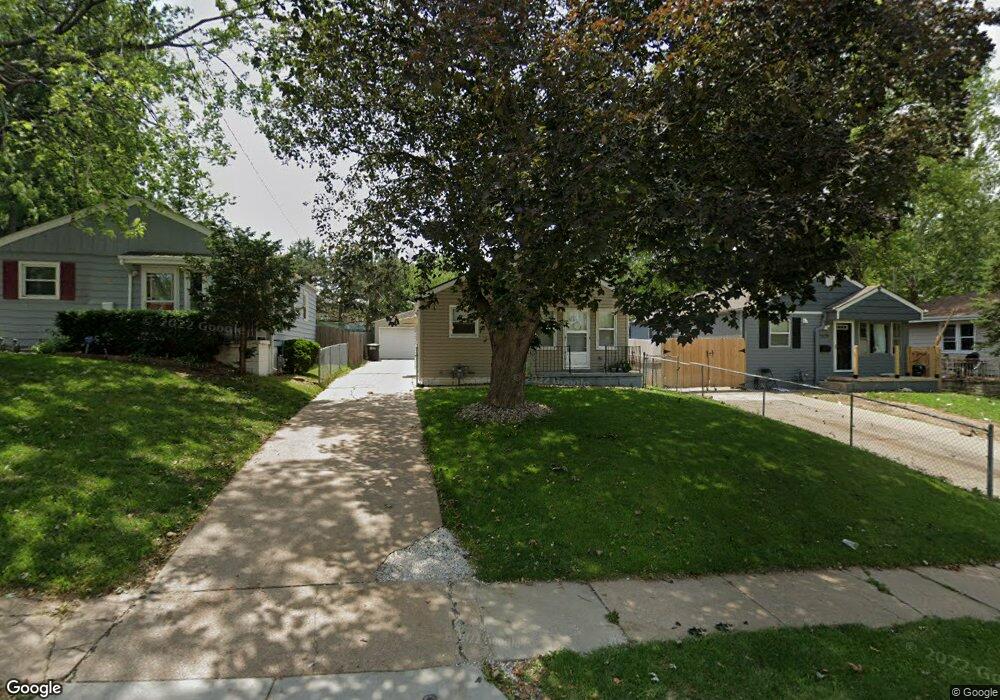
3925 Monroe St Omaha, NE 68107
South Central Omaha NeighborhoodEstimated Value: $177,000 - $210,000
2
Beds
2
Baths
983
Sq Ft
$198/Sq Ft
Est. Value
About This Home
This home is located at 3925 Monroe St, Omaha, NE 68107 and is currently estimated at $195,049, approximately $198 per square foot. 3925 Monroe St is a home located in Douglas County with nearby schools including Gilder Elementary School, Bryan Middle School, and Bryan High School.
Ownership History
Date
Name
Owned For
Owner Type
Purchase Details
Closed on
Nov 22, 2024
Sold by
Lee Jimmy G and Lee Susan A
Bought by
Monarrez Brenda
Current Estimated Value
Purchase Details
Closed on
Apr 19, 2011
Sold by
Federal National Mortgage Association
Bought by
Lee Jimmy G
Purchase Details
Closed on
Sep 30, 2010
Sold by
Rubek Russell R
Bought by
Federal National Mortgage Association
Create a Home Valuation Report for This Property
The Home Valuation Report is an in-depth analysis detailing your home's value as well as a comparison with similar homes in the area
Home Values in the Area
Average Home Value in this Area
Purchase History
| Date | Buyer | Sale Price | Title Company |
|---|---|---|---|
| Monarrez Brenda | $50,000 | Midwest Title | |
| Lee Jimmy G | -- | Ch | |
| Federal National Mortgage Association | $94,619 | None Available | |
| Federal National Mortgage Association | $94,619 | None Available |
Source: Public Records
Tax History Compared to Growth
Tax History
| Year | Tax Paid | Tax Assessment Tax Assessment Total Assessment is a certain percentage of the fair market value that is determined by local assessors to be the total taxable value of land and additions on the property. | Land | Improvement |
|---|---|---|---|---|
| 2024 | $2,777 | $146,400 | $11,100 | $135,300 |
| 2023 | $2,777 | $131,600 | $11,100 | $120,500 |
| 2022 | $2,700 | $126,500 | $6,000 | $120,500 |
| 2021 | $2,195 | $103,700 | $6,000 | $97,700 |
| 2020 | $2,220 | $103,700 | $6,000 | $97,700 |
| 2019 | $1,885 | $87,800 | $6,000 | $81,800 |
| 2018 | $1,817 | $84,500 | $6,000 | $78,500 |
| 2017 | $1,826 | $84,500 | $6,000 | $78,500 |
| 2016 | $1,813 | $84,500 | $6,000 | $78,500 |
| 2015 | $1,789 | $84,500 | $6,000 | $78,500 |
| 2014 | $1,789 | $84,500 | $6,000 | $78,500 |
Source: Public Records
Map
Nearby Homes