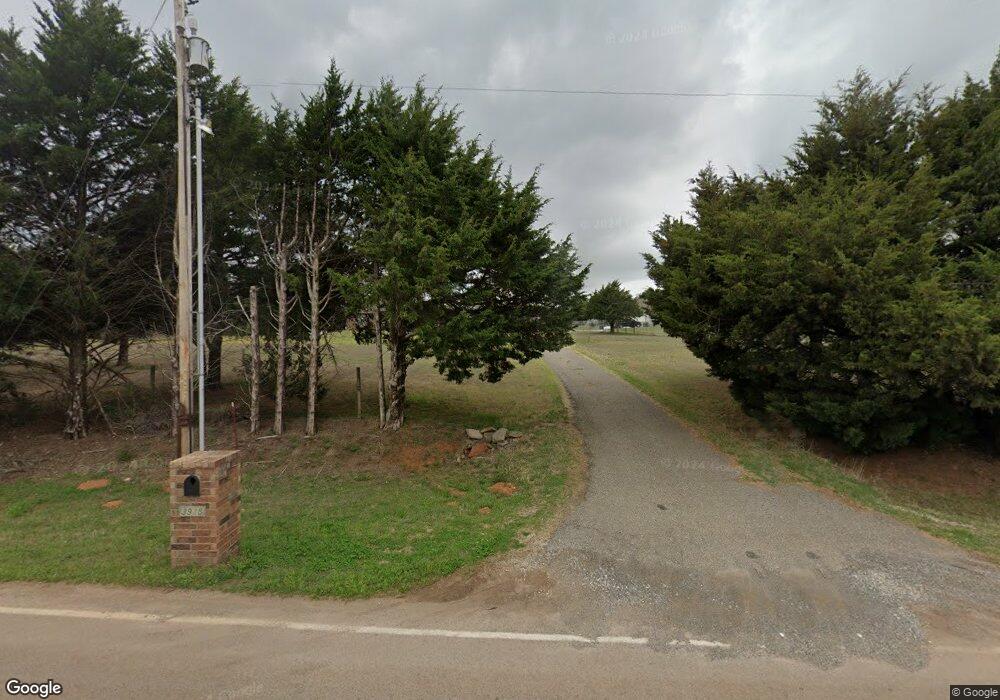
3925 N Sooner Rd Oklahoma City, OK 73141
Estimated Value: $334,000 - $407,000
3
Beds
2
Baths
1,782
Sq Ft
$213/Sq Ft
Est. Value
About This Home
This home is located at 3925 N Sooner Rd, Oklahoma City, OK 73141 and is currently estimated at $380,247, approximately $213 per square foot. 3925 N Sooner Rd is a home located in Oklahoma County with nearby schools including Townsend Elementary School, Midwest City Middle School, and Del City High School.
Ownership History
Date
Name
Owned For
Owner Type
Purchase Details
Closed on
May 21, 2025
Sold by
Mitchell James L and Mitchell Diana
Bought by
Mitchell James L and Mitchell Diana
Current Estimated Value
Purchase Details
Closed on
Aug 4, 2023
Sold by
Mitchell James L and Mitchell Diana M
Bought by
Mitchell James L and Mitchell Diana M
Purchase Details
Closed on
Jan 31, 2003
Sold by
Cimarron Land Inc
Bought by
Dorsey Marlon
Purchase Details
Closed on
Apr 24, 2002
Sold by
Cimarron Land Inc
Bought by
Mitchell James L and Mitchell Diana M
Purchase Details
Closed on
Mar 11, 2002
Sold by
Affiliated Home Center
Bought by
Cimmaron Land Inc
Purchase Details
Closed on
Nov 5, 2001
Sold by
Cimarron Land Inc
Bought by
Harrington Eudora
Create a Home Valuation Report for This Property
The Home Valuation Report is an in-depth analysis detailing your home's value as well as a comparison with similar homes in the area
Home Values in the Area
Average Home Value in this Area
Purchase History
| Date | Buyer | Sale Price | Title Company |
|---|---|---|---|
| Mitchell James L | -- | None Listed On Document | |
| Mitchell James L | -- | None Listed On Document | |
| Mitchell James L | -- | None Listed On Document | |
| Dorsey Marlon | $25,000 | American Guaranty Title Co | |
| Mitchell James L | -- | American Guaranty Title Co | |
| Cimmaron Land Inc | -- | Amer Guaranty Title Co | |
| Harrington Eudora | $25,000 | American Guaranty Title Co |
Source: Public Records
Tax History Compared to Growth
Tax History
| Year | Tax Paid | Tax Assessment Tax Assessment Total Assessment is a certain percentage of the fair market value that is determined by local assessors to be the total taxable value of land and additions on the property. | Land | Improvement |
|---|---|---|---|---|
| 2024 | $3,261 | $26,376 | $2,163 | $24,213 |
| 2023 | $3,025 | $25,607 | $2,473 | $23,134 |
| 2022 | $2,914 | $24,862 | $2,142 | $22,720 |
| 2021 | $2,886 | $24,138 | $2,491 | $21,647 |
| 2020 | $2,877 | $23,435 | $2,665 | $20,770 |
| 2019 | $2,715 | $22,753 | $2,513 | $20,240 |
| 2018 | $2,632 | $22,091 | $0 | $0 |
| 2017 | $2,582 | $21,446 | $2,675 | $18,771 |
| 2016 | $2,555 | $20,821 | $2,809 | $18,012 |
| 2015 | $2,503 | $20,215 | $3,184 | $17,031 |
| 2014 | $2,461 | $19,980 | $3,184 | $16,796 |
Source: Public Records
Map
Nearby Homes
- 0 N Sooner Rd Unit 1184327
- 4335 NE 42nd St
- 5216 Strait Dr
- 3708 NE Kings Row
- 5420 NE 56th St
- 3809 Kings Ct
- 4001 Randels Way
- 3400 Norcrest Dr
- 1808 N Cherry Ave
- 3205 E Maxwell Dr
- N Air Depot Blvd
- 3001 Norcrest Dr
- 2835 NE 23rd St
- 4808 Rose Rock Dr
- 6801 N Sooner Rd
- 4433 Redbud Cir
- 4404 Redbud Cir
- 4429 Redbud Cir
- 4425 Redbud Cir
- 2809 NE 25th St
- 4001 N Sooner Rd
- 0 N Sooner Rd Unit 1059501
- 00 N Sooner Rd
- 0 N Sooner Rd Unit 980146
- 0 N Sooner Rd
- 4425 N Sooner Rd
- 4000 N Sooner Rd
- 4010 N Sooner Rd
- 4020 N Sooner Rd
- 4525 N Sooner Rd
- 5104 NE 38th St
- 5500 NE 46th St
- 5105 NE 38th St
- 3816 Haile Terrace
- 3808 Haile Terrace
- 3800 Haile Terrace
- 3804 Haile Terrace
- 5100 NE 38th St
- 3812 Haile Terrace
- 5101 NE 38th St