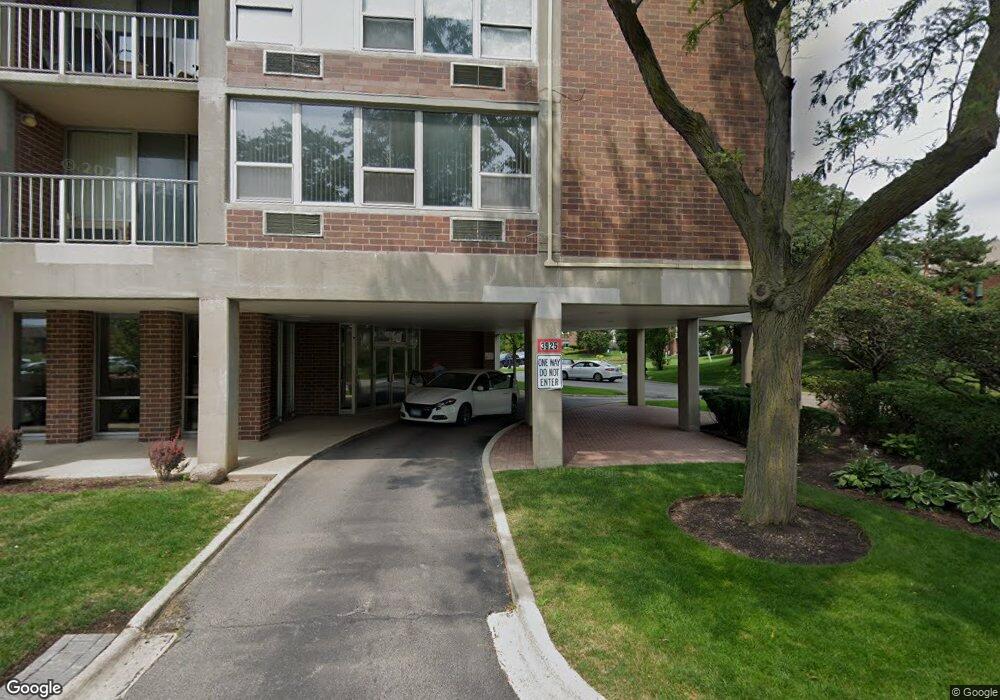
Towers of Triumvera 3925 Triumvera Dr Unit A17F Glenview, IL 60025
Estimated Value: $228,000 - $261,000
2
Beds
--
Bath
1,165
Sq Ft
$210/Sq Ft
Est. Value
About This Home
This home is located at 3925 Triumvera Dr Unit A17F, Glenview, IL 60025 and is currently estimated at $244,195, approximately $209 per square foot. 3925 Triumvera Dr Unit A17F is a home located in Cook County with nearby schools including Henking Elementary School, Hoffman Elementary School, and Springman Middle School.
Ownership History
Date
Name
Owned For
Owner Type
Purchase Details
Closed on
Aug 14, 2025
Sold by
Griffith Ralph
Bought by
Griffith Ralph and Gillenwater Stephanie
Current Estimated Value
Purchase Details
Closed on
Sep 9, 2024
Sold by
Michael I Levin Declaration Of Trust and Levin Michael I
Bought by
Griffith Ralph
Home Financials for this Owner
Home Financials are based on the most recent Mortgage that was taken out on this home.
Original Mortgage
$192,000
Interest Rate
8.63%
Mortgage Type
New Conventional
Purchase Details
Closed on
May 8, 2015
Sold by
Levin Michael I and Sylvia Levin Trust
Bought by
Levin Michael I and Michael I Levin Declaration Of
Purchase Details
Closed on
Jun 17, 2002
Sold by
Teichner Leon J
Bought by
Levin Sylvia and Sylvia Levin Trust
Purchase Details
Closed on
Aug 29, 1994
Sold by
Freed Ronald
Bought by
Teichner Leon J
Purchase Details
Closed on
Aug 8, 1994
Sold by
Freed Gary W
Bought by
Freed Ronald
Purchase Details
Closed on
Jul 28, 1994
Sold by
Dickinson Elissa J Freed
Bought by
Freed Ronald
Create a Home Valuation Report for This Property
The Home Valuation Report is an in-depth analysis detailing your home's value as well as a comparison with similar homes in the area
Home Values in the Area
Average Home Value in this Area
Purchase History
| Date | Buyer | Sale Price | Title Company |
|---|---|---|---|
| Griffith Ralph | -- | None Listed On Document | |
| Griffith Ralph | $240,000 | Chicago Title | |
| Levin Michael I | -- | None Available | |
| Levin Sylvia | $154,000 | -- | |
| Teichner Leon J | $103,000 | -- | |
| Freed Ronald | -- | -- | |
| Freed Ronald | -- | -- |
Source: Public Records
Mortgage History
| Date | Status | Borrower | Loan Amount |
|---|---|---|---|
| Previous Owner | Griffith Ralph | $192,000 |
Source: Public Records
Tax History Compared to Growth
Tax History
| Year | Tax Paid | Tax Assessment Tax Assessment Total Assessment is a certain percentage of the fair market value that is determined by local assessors to be the total taxable value of land and additions on the property. | Land | Improvement |
|---|---|---|---|---|
| 2024 | $2,211 | $15,365 | $400 | $14,965 |
| 2023 | $3,410 | $15,365 | $400 | $14,965 |
| 2022 | $3,410 | $15,365 | $400 | $14,965 |
| 2021 | $3,628 | $14,026 | $272 | $13,754 |
| 2020 | $3,606 | $14,026 | $272 | $13,754 |
| 2019 | $3,376 | $15,545 | $272 | $15,273 |
| 2018 | $2,784 | $11,477 | $236 | $11,241 |
| 2017 | $2,707 | $11,477 | $236 | $11,241 |
| 2016 | $2,550 | $11,477 | $236 | $11,241 |
| 2015 | $2,300 | $9,249 | $190 | $9,059 |
| 2014 | $2,250 | $9,249 | $190 | $9,059 |
| 2013 | $2,186 | $9,249 | $190 | $9,059 |
Source: Public Records
About Towers of Triumvera
Map
Nearby Homes
- 701 Forum Square Unit 609
- 3732 Capri Ct Unit T18A
- 600 Naples Ct Unit 510
- 600 Naples Ct Unit 107
- 600 Naples Ct Unit 608
- 4150 Central Rd Unit 3E
- 10385 Dearlove Rd Unit 1I
- 625 Quincy Bridge Ln Unit 301
- 10347 Dearlove Rd Unit 302
- 4170 Cove Ln Unit 2B
- 917 Tamer Ln
- 3505 Linneman St
- 533 Cherry Ln
- 9517 W Central Rd
- 4004 Denice Ct Unit 3
- 1018 Castilian Ct Unit A205
- 9411 Harrison St Unit 471494
- 1026 Castilian Ct Unit D162
- 518 Elder Ln
- 10009 Meadow Ln
- 3925 Triumvera Dr Unit 3B
- 3925 Triumvera Dr Unit 4F
- 3925 Triumvera Dr Unit 10D
- 3925 Triumvera Dr Unit 4B
- 3925 Triumvera Dr Unit 14F
- 3925 Triumvera Dr Unit 5E
- 3925 Triumvera Dr Unit A12B
- 3925 Triumvera Dr Unit A15C
- 3925 Triumvera Dr Unit A4F
- 3925 Triumvera Dr Unit A10E
- 3925 Triumvera Dr Unit A4B
- 3925 Triumvera Dr Unit A12F
- 3925 Triumvera Dr Unit A17H
- 3925 Triumvera Dr Unit A6H
- 3925 Triumvera Dr Unit A10J
- 3925 Triumvera Dr Unit A2B
- 3925 Triumvera Dr Unit A3H
- 3925 Triumvera Dr Unit A5D
- 3925 Triumvera Dr Unit A15F
- 3925 Triumvera Dr Unit A10D