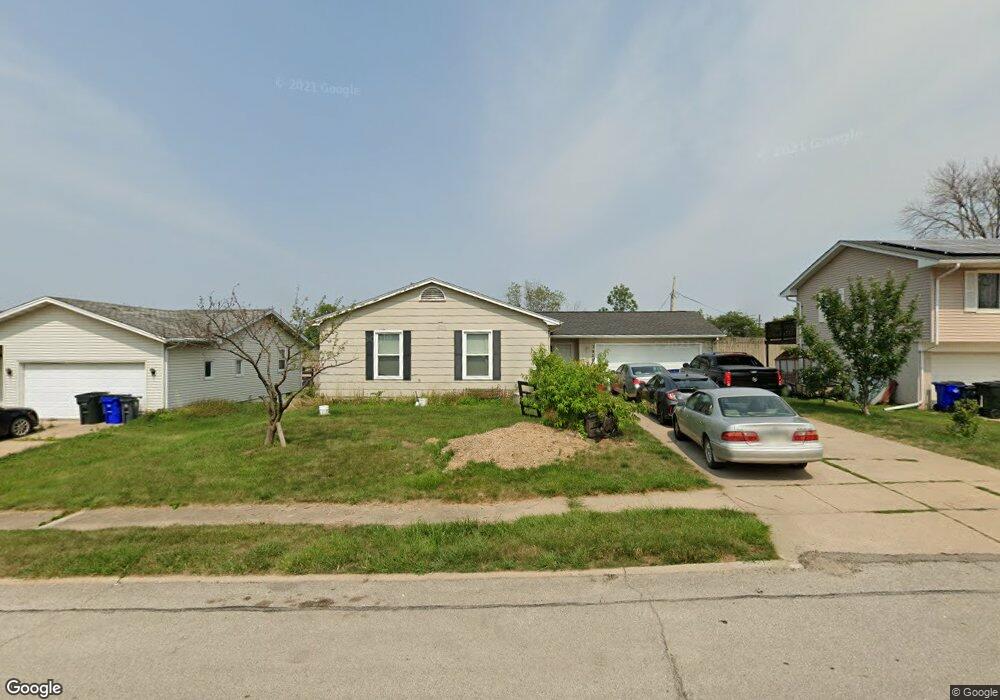
3926 Redbud Rd NE Cedar Rapids, IA 52402
Estimated Value: $198,000 - $253,000
5
Beds
3
Baths
1,361
Sq Ft
$171/Sq Ft
Est. Value
About This Home
This home is located at 3926 Redbud Rd NE, Cedar Rapids, IA 52402 and is currently estimated at $232,689, approximately $170 per square foot. 3926 Redbud Rd NE is a home located in Linn County with nearby schools including Pierce Elementary School, Franklin Middle School, and John F. Kennedy High School.
Ownership History
Date
Name
Owned For
Owner Type
Purchase Details
Closed on
Aug 12, 2003
Sold by
Khairallah Elie P and Khairallah Lillian
Bought by
Ramirez Colin Pedro
Current Estimated Value
Home Financials for this Owner
Home Financials are based on the most recent Mortgage that was taken out on this home.
Original Mortgage
$114,971
Outstanding Balance
$50,075
Interest Rate
5.47%
Mortgage Type
FHA
Estimated Equity
$182,614
Purchase Details
Closed on
Dec 3, 2001
Sold by
Romare Jeffrey M and Romare Julia A
Bought by
Khairallah Elie P
Home Financials for this Owner
Home Financials are based on the most recent Mortgage that was taken out on this home.
Original Mortgage
$116,550
Interest Rate
6.6%
Purchase Details
Closed on
Dec 11, 1997
Sold by
Burke Wilodene
Bought by
Romare Jeffrey M and Romare Julia A
Home Financials for this Owner
Home Financials are based on the most recent Mortgage that was taken out on this home.
Original Mortgage
$112,000
Interest Rate
7.26%
Create a Home Valuation Report for This Property
The Home Valuation Report is an in-depth analysis detailing your home's value as well as a comparison with similar homes in the area
Home Values in the Area
Average Home Value in this Area
Purchase History
| Date | Buyer | Sale Price | Title Company |
|---|---|---|---|
| Ramirez Colin Pedro | $115,500 | -- | |
| Khairallah Elie P | $129,000 | -- | |
| Romare Jeffrey M | $117,500 | -- |
Source: Public Records
Mortgage History
| Date | Status | Borrower | Loan Amount |
|---|---|---|---|
| Open | Ramirez Colin Pedro | $114,971 | |
| Previous Owner | Khairallah Elie P | $116,550 | |
| Previous Owner | Romare Jeffrey M | $112,000 |
Source: Public Records
Tax History Compared to Growth
Tax History
| Year | Tax Paid | Tax Assessment Tax Assessment Total Assessment is a certain percentage of the fair market value that is determined by local assessors to be the total taxable value of land and additions on the property. | Land | Improvement |
|---|---|---|---|---|
| 2025 | $3,606 | $237,200 | $43,300 | $193,900 |
| 2024 | $3,742 | $214,200 | $39,800 | $174,400 |
| 2023 | $3,742 | $214,200 | $39,800 | $174,400 |
| 2022 | $3,410 | $186,300 | $34,700 | $151,600 |
| 2021 | $3,484 | $173,600 | $32,900 | $140,700 |
| 2020 | $3,484 | $166,500 | $29,500 | $137,000 |
| 2019 | $2,934 | $144,600 | $27,700 | $116,900 |
| 2018 | $2,848 | $144,600 | $27,700 | $116,900 |
| 2017 | $2,819 | $135,800 | $27,700 | $108,100 |
| 2016 | $2,819 | $132,600 | $27,700 | $104,900 |
| 2015 | $2,909 | $136,758 | $31,185 | $105,573 |
| 2014 | $2,724 | $136,758 | $31,185 | $105,573 |
| 2013 | $2,662 | $136,758 | $31,185 | $105,573 |
Source: Public Records
Map
Nearby Homes
- 2044 Evergreen St NE
- 2106 42nd St NE
- 3858 Northwood Dr NE
- 2041 Birchwood Dr NE
- 4216 Marilyn Dr NE
- 1611 Hollywood Blvd NE
- 2400 Brookland Dr NE
- 1006 Messina Dr NE
- 1138 Messina Dr NE
- 4309 Benton St NE
- 1638 47th St NE
- 1721 34th St NE
- 2520 Falbrook Dr NE
- 1456 Miami Dr NE
- 4609 White Pine Dr NE
- 2445 Glass Rd NE
- 3704 Richmond Rd NE
- 2611 Brookland Dr NE
- 3711 Oakland Rd NE
- 3008 Circle Hill Ct NE
- 3932 Redbud Rd NE
- 3920 Redbud Rd NE
- 3914 Redbud Rd NE
- 3938 Redbud Rd NE
- 3927 Redbud Rd NE
- 3921 Redbud Rd NE
- 3935 Redbud Rd NE
- 3915 Redbud Rd NE
- 3908 Redbud Rd NE
- 2036 Evergreen St NE
- 3909 Redbud Rd NE
- 2049 Evergreen St NE
- 3914 Nancy Jane Ln NE
- 3902 Redbud Rd NE
- 3920 Nancy Jane Ln NE
- 3908 Nancy Jane Ln NE
- 3903 Redbud Rd NE
- 2101 Evergreen St NE
- 2052 Evergreen St NE
- 3902 Nancy Jane Ln NE