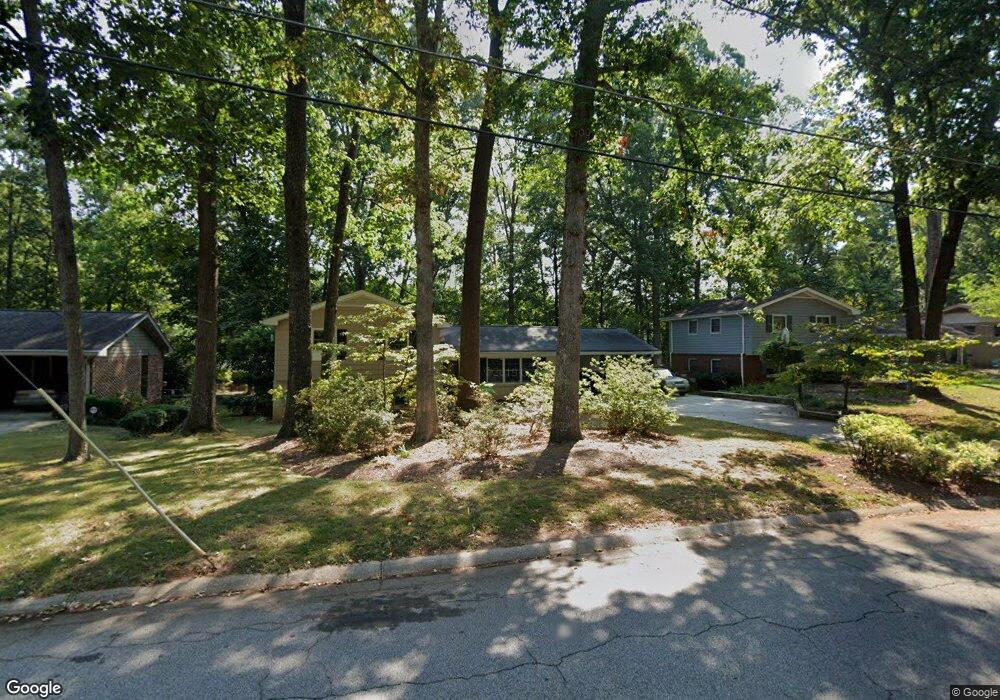
3927 Gloucester Dr Tucker, GA 30084
Estimated Value: $370,091 - $411,000
4
Beds
2
Baths
1,825
Sq Ft
$212/Sq Ft
Est. Value
About This Home
This home is located at 3927 Gloucester Dr, Tucker, GA 30084 and is currently estimated at $387,523, approximately $212 per square foot. 3927 Gloucester Dr is a home located in DeKalb County with nearby schools including Brockett Elementary School, Tucker Middle School, and Tucker High School.
Ownership History
Date
Name
Owned For
Owner Type
Purchase Details
Closed on
Jul 31, 2013
Sold by
Boggs Mark
Bought by
Brite Mark Irving
Current Estimated Value
Purchase Details
Closed on
Dec 22, 2010
Sold by
Boggs Janet I
Bought by
Boggs Mark
Purchase Details
Closed on
Aug 12, 2010
Sold by
Boggs Jan I
Bought by
Boggs Mark
Purchase Details
Closed on
Mar 22, 2000
Sold by
Boggs Mark
Bought by
Boggs Mark and Boggs Janet
Purchase Details
Closed on
Nov 23, 1998
Sold by
Buser Patricia
Bought by
Boggs Mark
Home Financials for this Owner
Home Financials are based on the most recent Mortgage that was taken out on this home.
Original Mortgage
$103,200
Interest Rate
6.95%
Mortgage Type
New Conventional
Create a Home Valuation Report for This Property
The Home Valuation Report is an in-depth analysis detailing your home's value as well as a comparison with similar homes in the area
Home Values in the Area
Average Home Value in this Area
Purchase History
| Date | Buyer | Sale Price | Title Company |
|---|---|---|---|
| Brite Mark Irving | -- | -- | |
| Boggs Mark | $148,000 | -- | |
| Boggs Mark | -- | -- | |
| Boggs Mark | -- | -- | |
| Boggs Mark | $129,000 | -- |
Source: Public Records
Mortgage History
| Date | Status | Borrower | Loan Amount |
|---|---|---|---|
| Previous Owner | Boggs Mark | $103,200 |
Source: Public Records
Tax History
| Year | Tax Paid | Tax Assessment Tax Assessment Total Assessment is a certain percentage of the fair market value that is determined by local assessors to be the total taxable value of land and additions on the property. | Land | Improvement |
|---|---|---|---|---|
| 2025 | $4,240 | $133,120 | $36,000 | $97,120 |
| 2024 | $6,378 | $133,120 | $36,000 | $97,120 |
| 2023 | $6,378 | $86,960 | $27,827 | $59,133 |
Source: Public Records
Map
Nearby Homes
- 1846 Joppa Ln Unit 2
- 3718 Sheridan St
- 3716 Sheridan St
- 1885 Weston Ln
- 1888 Weston Ln
- 1926 Brocken Way
- 3924 Barr Cir
- 4094 Barr Cir
- 3755 Bailey Rd
- 1837 Morning Star Ln
- 3603 Woodbriar Cir Unit M
- 3873 Cedar Cir Unit 3873
- 3891 Cedar Cir Unit 3891
- 3599 Woodbriar Cir Unit A
- 2049 Shady Ln
- 1887 Robinhill Ct
- 2042 Shady Ln
- 1723 Zemory Dr
- 3630 Prince Way
- 3965 Camelot Ct
- 3921 Gloucester Dr
- 3935 Gloucester Dr
- 1816 Samaria Trail
- 3913 Gloucester Dr Unit 1
- 1804 Samaria Trail
- 3936 Gloucester Dr
- 3918 Gloucester Dr
- 1796 Samaria Trail
- 3905 Gloucester Dr
- 3947 Gloucester Dr
- 3947 Gloucester Dr Unit 3
- 3908 Gloucester Dr
- 1788 Samaria Trail
- 3818 Sarahs Ln
- 3946 Gloucester Dr
- 3899 Gloucester Dr
- 3815 Sarahs Ln
- 1829 Samaria Trail
- 1811 Samaria Trail
- 3957 Gloucester Dr Unit 3
Your Personal Tour Guide
Ask me questions while you tour the home.