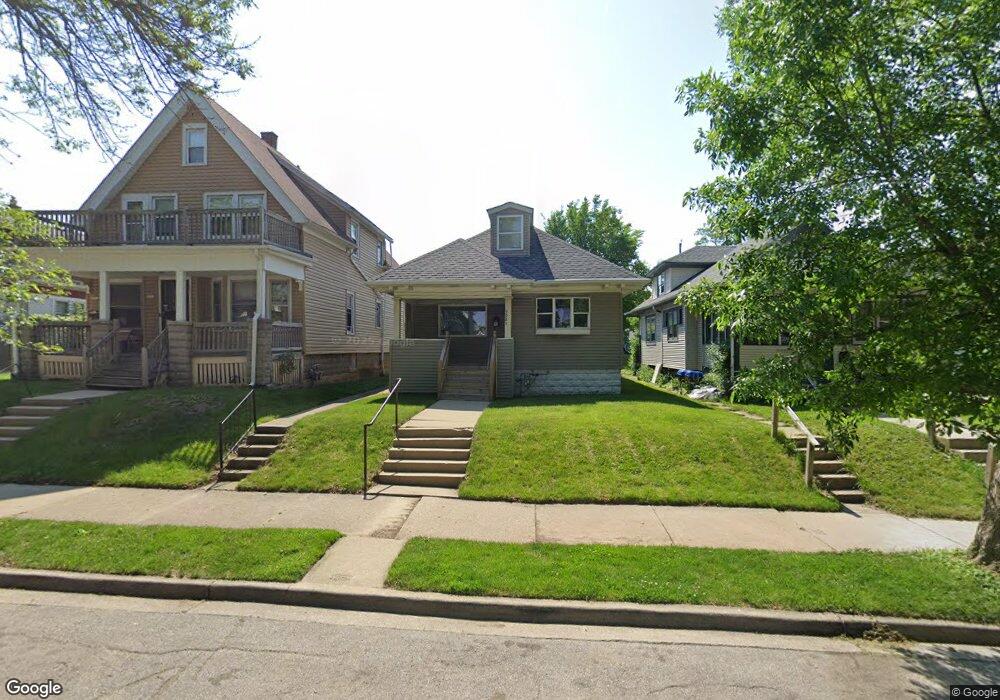
3927 N 11th St Milwaukee, WI 53206
Arlington Heights NeighborhoodEstimated Value: $126,000 - $178,000
3
Beds
2
Baths
1,234
Sq Ft
$124/Sq Ft
Est. Value
About This Home
This home is located at 3927 N 11th St, Milwaukee, WI 53206 and is currently estimated at $152,401, approximately $123 per square foot. 3927 N 11th St is a home located in Milwaukee County with nearby schools including Dr. Martin Luther King, Jr. School, Craig Montessori School, and Milwaukee German Immersion School.
Ownership History
Date
Name
Owned For
Owner Type
Purchase Details
Closed on
Dec 20, 2007
Sold by
Interim Funding Llc
Bought by
Moore Sheila A
Current Estimated Value
Home Financials for this Owner
Home Financials are based on the most recent Mortgage that was taken out on this home.
Original Mortgage
$84,500
Interest Rate
6.27%
Mortgage Type
Purchase Money Mortgage
Purchase Details
Closed on
Dec 5, 2007
Sold by
May Timothy M
Bought by
Interim Funding Llc
Home Financials for this Owner
Home Financials are based on the most recent Mortgage that was taken out on this home.
Original Mortgage
$84,500
Interest Rate
6.27%
Mortgage Type
Purchase Money Mortgage
Purchase Details
Closed on
Nov 28, 2005
Sold by
Riverhouse Investments Llc
Bought by
May Timothy M
Purchase Details
Closed on
Oct 21, 2005
Sold by
Taylor Richard
Bought by
Riverhouse Investments Llc
Purchase Details
Closed on
Mar 10, 2005
Sold by
Hagler Robert W and Hagler Beulah M
Bought by
Taylor Richard
Create a Home Valuation Report for This Property
The Home Valuation Report is an in-depth analysis detailing your home's value as well as a comparison with similar homes in the area
Home Values in the Area
Average Home Value in this Area
Purchase History
| Date | Buyer | Sale Price | Title Company |
|---|---|---|---|
| Moore Sheila A | $87,000 | Premier Title & Closing Serv | |
| Interim Funding Llc | -- | Premier Title & Closing Serv | |
| May Timothy M | $27,500 | None Available | |
| Riverhouse Investments Llc | $8,000 | -- | |
| Taylor Richard | $62,000 | Advent Title Llc |
Source: Public Records
Mortgage History
| Date | Status | Borrower | Loan Amount |
|---|---|---|---|
| Closed | Moore Sheila A | $84,500 |
Source: Public Records
Tax History Compared to Growth
Tax History
| Year | Tax Paid | Tax Assessment Tax Assessment Total Assessment is a certain percentage of the fair market value that is determined by local assessors to be the total taxable value of land and additions on the property. | Land | Improvement |
|---|---|---|---|---|
| 2024 | $1,730 | $91,500 | $3,100 | $88,400 |
| 2023 | $1,782 | $75,400 | $3,100 | $72,300 |
| 2022 | $1,480 | $75,400 | $3,100 | $72,300 |
| 2021 | $1,077 | $53,000 | $3,000 | $50,000 |
| 2020 | $1,128 | $53,000 | $3,000 | $50,000 |
| 2019 | $903 | $43,600 | $3,100 | $40,500 |
| 2018 | $898 | $43,600 | $3,100 | $40,500 |
| 2017 | $787 | $36,300 | $3,100 | $33,200 |
| 2016 | $807 | $35,700 | $3,100 | $32,600 |
| 2015 | $901 | $37,900 | $3,100 | $34,800 |
| 2014 | $985 | $40,100 | $3,100 | $37,000 |
| 2013 | -- | $44,600 | $3,100 | $41,500 |
Source: Public Records
Map
Nearby Homes
- 1222 W Capitol Dr
- 3936 N 14th St Unit 3938
- 3906 N 14th St
- 3848 N 10th St
- 4040 N 11th St
- 3746 N 11th St
- 3868 N 15th St
- 3783 N 9th St
- 3721 N 10th St
- 1006 W Nash St
- 4047 N 15th St
- 3611 N 12th St
- 3634 N 9th St
- 3573 N 11th St
- 3643 N 15th St
- 3746 N 17th St Unit 3748
- 1223 W Olive St Unit 1225
- 3558 N 11th St
- 1229 W Olive St
- 3551 N 13th St
- 3931 N 11th St
- 3921 N 11th St
- 3935 N 11th St
- 3915 N 11th St
- 3939 N 11th St
- 3909 N 11th St
- 3909 N 11 St Unit 3909
- 3947 N 11th St
- 3926 N 12th St
- 3930 N 12th St
- 3920 N 12th St
- 3936 N 12th St
- 3916 N 12th St
- 3905 N 11th St
- 3949 N 11th St
- 3912 N 12th St
- 3940 N 12th St
- 3926 N 11th St
- 3930 N 11th St
- 3920 N 11th St Unit 3922