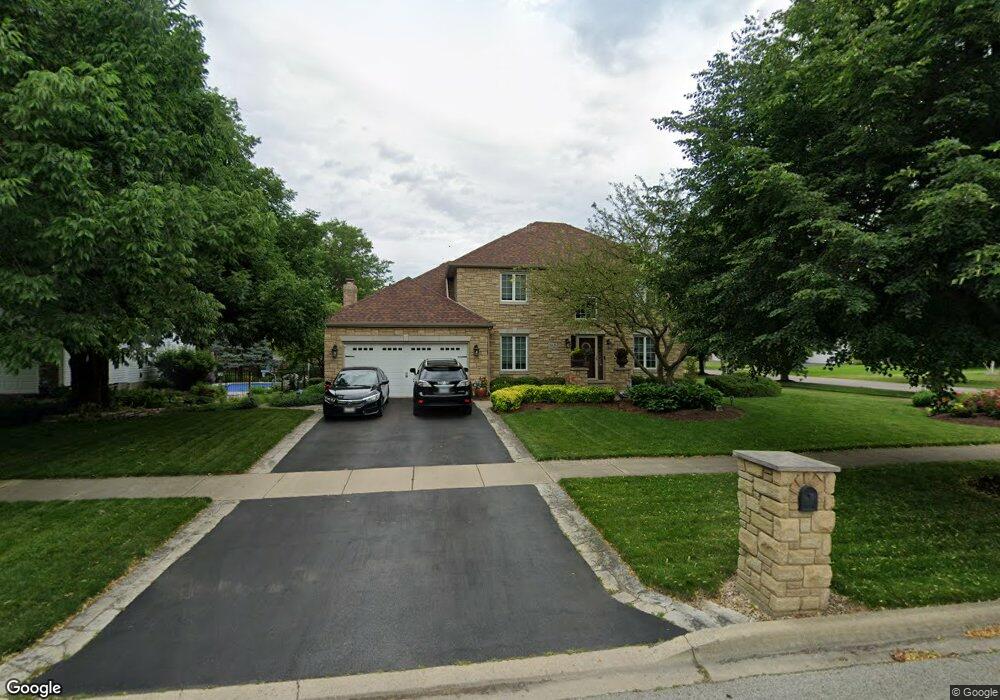
3928 Falcon Dr Naperville, IL 60564
Crestview Knoll NeighborhoodEstimated Value: $524,000 - $683,000
Studio
1
Bath
2,531
Sq Ft
$240/Sq Ft
Est. Value
About This Home
This home is located at 3928 Falcon Dr, Naperville, IL 60564 and is currently estimated at $608,619, approximately $240 per square foot. 3928 Falcon Dr is a home located in Will County with nearby schools including Clifford Crone Middle School, Neuqua Valley High School, and Covenant Classical School.
Ownership History
Date
Name
Owned For
Owner Type
Purchase Details
Closed on
Jan 30, 2022
Sold by
Ippolito Joseph G and Ippolito Kathryn M
Bought by
Ippolito Joseph G and Ippolito Kathryn M
Current Estimated Value
Purchase Details
Closed on
Jan 31, 2000
Sold by
Julifs Steven W and Julifs Melissa M
Bought by
Ippolito Joseph G and Ippolio Akthryn M
Home Financials for this Owner
Home Financials are based on the most recent Mortgage that was taken out on this home.
Original Mortgage
$180,001
Interest Rate
7.98%
Purchase Details
Closed on
Jan 5, 1995
Sold by
Roberts Construction Inc
Bought by
Julifs Steven W and Julifs Melissa M
Home Financials for this Owner
Home Financials are based on the most recent Mortgage that was taken out on this home.
Original Mortgage
$200,000
Interest Rate
8.25%
Create a Home Valuation Report for This Property
The Home Valuation Report is an in-depth analysis detailing your home's value as well as a comparison with similar homes in the area
Home Values in the Area
Average Home Value in this Area
Purchase History
| Date | Buyer | Sale Price | Title Company |
|---|---|---|---|
| Ippolito Joseph G | -- | None Listed On Document | |
| Ippolito Joseph G | $260,000 | Chicago Title Insurance Co | |
| Julifs Steven W | $213,500 | Chicago Title Insurance Co |
Source: Public Records
Mortgage History
| Date | Status | Borrower | Loan Amount |
|---|---|---|---|
| Previous Owner | Ippolito Joseph G | $180,001 | |
| Previous Owner | Julifs Steven W | $200,000 |
Source: Public Records
Tax History
| Year | Tax Paid | Tax Assessment Tax Assessment Total Assessment is a certain percentage of the fair market value that is determined by local assessors to be the total taxable value of land and additions on the property. | Land | Improvement |
|---|---|---|---|---|
| 2024 | $9,991 | $160,541 | $36,083 | $124,458 |
| 2023 | $9,991 | $141,820 | $31,875 | $109,945 |
| 2022 | $10,407 | $149,645 | $30,154 | $119,491 |
| 2021 | $9,944 | $142,519 | $28,718 | $113,801 |
| 2020 | $9,754 | $140,261 | $28,263 | $111,998 |
| 2019 | $9,585 | $136,308 | $27,466 | $108,842 |
| 2018 | $9,670 | $135,092 | $26,861 | $108,231 |
| 2017 | $9,521 | $131,605 | $26,168 | $105,437 |
| 2016 | $9,502 | $128,772 | $25,605 | $103,167 |
| 2015 | $9,118 | $123,819 | $24,620 | $99,199 |
| 2014 | $9,118 | $118,047 | $24,620 | $93,427 |
| 2013 | $9,118 | $118,047 | $24,620 | $93,427 |
Source: Public Records
Map
Nearby Homes
- 2344 Corn Lily Rd
- 3847 Gold Cup Ln
- 3635 Ambrosia Dr
- 29W376 Wagner Rd
- 2255 Wendt Cir
- 3307 Danlaur Ct Unit 6
- 3432 Redwing Dr Unit 2
- 24430 Boulevard de John
- 3060 Crystal Rock Rd
- 3415 Minito Ct
- 4711 Snapjack Cir
- 2836 Fairhauser Ct
- 1364 Saxon Ln
- 1367 Saxon Ln
- 3507 Grassmere Rd Unit IV
- 2423 Durango Ln
- 3807 Landsdown Ave
- 3027 Brossman St
- 4204 Falkner Dr Unit 3
- 2828 Bluewater Cir
- 3924 Falcon Dr
- 3915 Nighthawk Ct
- 3911 Nighthawk Ct
- 3920 Falcon Dr
- 3932 Mallard Ln
- 3928 Mallard Ln
- 3931 Falcon Dr
- 3927 Falcon Dr
- 3907 Nighthawk Ct
- 3935 Falcon Dr
- 3924 Mallard Ln
- 3923 Falcon Dr
- 3939 Falcon Dr
- 3920 Mallard Ln
- 3915 Falcon Dr
- 3920 Nighthawk Ct
- 3903 Nighthawk Ct
- 3916 Nighthawk Ct Unit 1
- 3912 Falcon Dr
- 3916 Mallard Ln
Your Personal Tour Guide
Ask me questions while you tour the home.