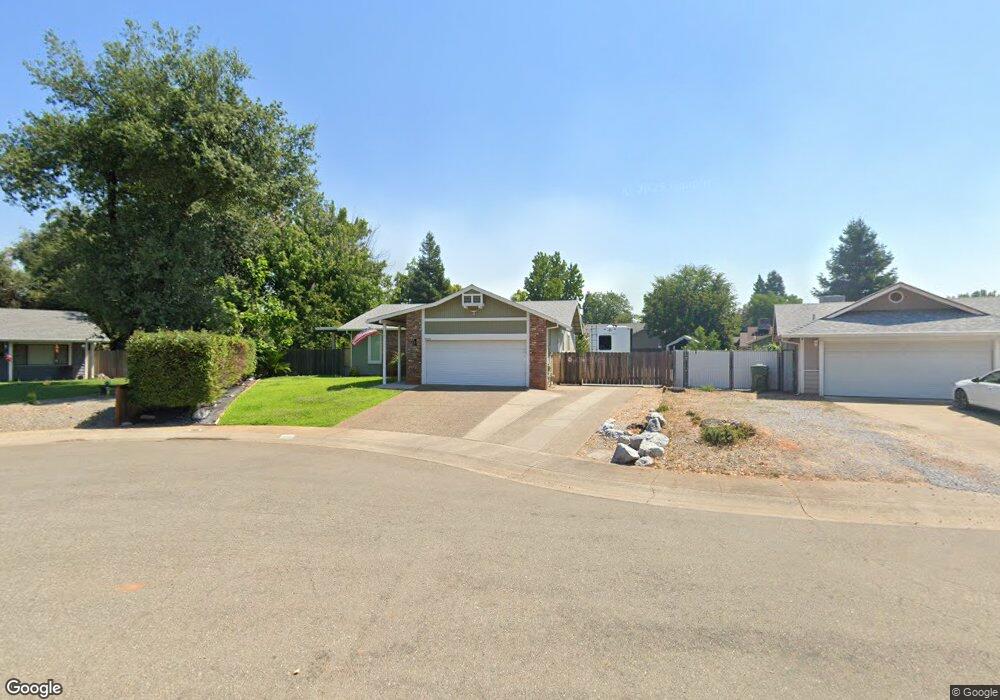
3929 Elin Ct Unit 1 Redding, CA 96002
Oak Haven NeighborhoodEstimated Value: $370,290 - $414,000
3
Beds
2
Baths
1,602
Sq Ft
$241/Sq Ft
Est. Value
About This Home
This home is located at 3929 Elin Ct Unit 1, Redding, CA 96002 and is currently estimated at $386,823, approximately $241 per square foot. 3929 Elin Ct Unit 1 is a home located in Shasta County with nearby schools including Alta Mesa Elementary School, Parsons Junior High School, and Enterprise High School.
Ownership History
Date
Name
Owned For
Owner Type
Purchase Details
Closed on
Feb 12, 2025
Sold by
Mckinney Kimberly A and Tighe Kimberly A
Bought by
Tighe Kimberly A Mckinney and Tighe Patrick W
Current Estimated Value
Home Financials for this Owner
Home Financials are based on the most recent Mortgage that was taken out on this home.
Original Mortgage
$99,625
Outstanding Balance
$99,035
Interest Rate
6.93%
Mortgage Type
Credit Line Revolving
Estimated Equity
$287,788
Purchase Details
Closed on
Nov 30, 2018
Sold by
Mckinney Kimberly A
Bought by
Mckinney Kimberly A and Tighe Patrick W
Home Financials for this Owner
Home Financials are based on the most recent Mortgage that was taken out on this home.
Original Mortgage
$40,000
Interest Rate
4.8%
Mortgage Type
Commercial
Purchase Details
Closed on
Apr 17, 2013
Sold by
Maxfield Helen S
Bought by
Mckinney Kimberly A
Home Financials for this Owner
Home Financials are based on the most recent Mortgage that was taken out on this home.
Original Mortgage
$176,739
Interest Rate
3.51%
Mortgage Type
FHA
Purchase Details
Closed on
Mar 14, 2013
Sold by
Munnerlyn Ricky Kelvin
Bought by
Maxfield Helen S
Home Financials for this Owner
Home Financials are based on the most recent Mortgage that was taken out on this home.
Original Mortgage
$176,739
Interest Rate
3.51%
Mortgage Type
FHA
Purchase Details
Closed on
Jun 28, 2012
Sold by
Maxfield Helen S
Bought by
Maxfield Helen S and Munnerlyn Ricky Kelvin
Purchase Details
Closed on
Oct 16, 2001
Sold by
Nobriga Robert T
Bought by
Maxfield Charles D and Maxfield Helen S
Home Financials for this Owner
Home Financials are based on the most recent Mortgage that was taken out on this home.
Original Mortgage
$62,800
Interest Rate
6.87%
Purchase Details
Closed on
Feb 5, 2001
Sold by
Mollin Steven Lee and Alery Renee
Bought by
Maxfield Charles D and Maxfield Helen S
Home Financials for this Owner
Home Financials are based on the most recent Mortgage that was taken out on this home.
Original Mortgage
$78,650
Interest Rate
7.08%
Purchase Details
Closed on
Jul 19, 1999
Sold by
Lannon Carl F
Bought by
Mollin Steven Lee and Mollin Alery Renee
Home Financials for this Owner
Home Financials are based on the most recent Mortgage that was taken out on this home.
Original Mortgage
$120,407
Interest Rate
7.63%
Mortgage Type
VA
Create a Home Valuation Report for This Property
The Home Valuation Report is an in-depth analysis detailing your home's value as well as a comparison with similar homes in the area
Home Values in the Area
Average Home Value in this Area
Purchase History
| Date | Buyer | Sale Price | Title Company |
|---|---|---|---|
| Tighe Kimberly A Mckinney | -- | Placer Title | |
| Mckinney Kimberly A | -- | Accommodation | |
| Mckinney Kimberly A | $180,000 | First American Title Company | |
| Maxfield Helen S | -- | First American Title Company | |
| Maxfield Helen S | -- | None Available | |
| Maxfield Charles D | $78,500 | Fidelity National Title Co | |
| Maxfield Charles D | $129,000 | Placer Title Company | |
| Mollin Steven Lee | $117,000 | Placer Title Company |
Source: Public Records
Mortgage History
| Date | Status | Borrower | Loan Amount |
|---|---|---|---|
| Open | Tighe Kimberly A Mckinney | $99,625 | |
| Previous Owner | Mckinney Kimberly A | $40,000 | |
| Previous Owner | Mckinney Kimberly A | $176,739 | |
| Previous Owner | Maxfield Charles D | $62,800 | |
| Previous Owner | Maxfield Charles D | $78,650 | |
| Previous Owner | Mollin Steven Lee | $120,407 |
Source: Public Records
Tax History
| Year | Tax Paid | Tax Assessment Tax Assessment Total Assessment is a certain percentage of the fair market value that is determined by local assessors to be the total taxable value of land and additions on the property. | Land | Improvement |
|---|---|---|---|---|
| 2025 | $2,342 | $221,644 | $49,250 | $172,394 |
| 2024 | $2,308 | $217,299 | $48,285 | $169,014 |
| 2023 | $2,308 | $213,039 | $47,339 | $165,700 |
| 2022 | $2,241 | $208,862 | $46,411 | $162,451 |
| 2021 | $2,163 | $204,767 | $45,501 | $159,266 |
| 2020 | $2,153 | $202,668 | $45,035 | $157,633 |
| 2019 | $2,134 | $198,695 | $44,152 | $154,543 |
| 2018 | $2,108 | $194,800 | $43,287 | $151,513 |
| 2017 | $2,144 | $190,982 | $42,439 | $148,543 |
| 2016 | $2,004 | $187,238 | $41,607 | $145,631 |
| 2015 | $1,986 | $184,427 | $40,983 | $143,444 |
| 2014 | $1,971 | $180,816 | $40,181 | $140,635 |
Source: Public Records
Map
Nearby Homes
- 1513 Harpole Rd
- 3528 Silverwood St
- 3466 Silverwood St
- 2068 Solar Way
- 3425 Silverwood St
- 1354 Harpole Rd
- 4302 Paulson Ln
- 3341 Timbercreek Dr
- 1289 Arizona St
- 3360 Lawrence Rd
- 2332 Venus Way
- 4487 Alta Saga Dr
- 3293 Middleton Ln
- 4608 Dandelion Dr
- 4624 Columbine Dr
- 3283 Middleton Ln
- 4724 Squirrel Run Ct
- 3361 Alta Mesa Dr
- 4648 Dandelion Dr
- 3594 Laramie St
- 3929 Elin Ct
- 3911 Elin Ct
- 3957 Elin Ct
- 3956 Brightwood Dr
- 3940 Brightwood Dr
- 3970 Brightwood Dr
- 3924 Brightwood Dr
- 1675 Galaxy Way
- 1669 Galaxy Way
- 3975 Elin Ct
- 3918 Elin Ct
- 3908 Brightwood Dr
- 1661 Galaxy Way
- 3936 Elin Ct
- 3964 Elin Ct
- 1655 Galaxy Way
- 3955 Brightwood Dr
- 3941 Brightwood Dr
- 3969 Brightwood Dr
- 3988 Elin Ct
Your Personal Tour Guide
Ask me questions while you tour the home.